The AAPG/Datapages Combined Publications Database
AAPG Bulletin
Full Text
![]() Click to view page images in PDF format.
Click to view page images in PDF format.
AAPG Bulletin, V.
DOI: 10.1306/0108181613217061
Determination of static and dynamic characteristics of microscopic pore-throat structure in a tight oil-bearing sandstone formation
Guangfeng Liu,1 Yaoxing Bai,2 Daihong Gu,3 Yang Lu,4 and Daoyong Yang5
1Key Laboratory of Petroleum Engineering of China Ministry of Education, China University of Petroleum (Beijing), 18 Fuxue Road, Changping District, Beijing 102249, China; Petroleum Systems Engineering, Faculty of Engineering and Applied Science, University of Regina, 3737 Wascana Parkway, Regina, Saskatchewan S4S 0A2, Canada; [email protected]
2Key Laboratory of Petroleum Engineering of China Ministry of Education, China University of Petroleum (Beijing), 18 Fuxue Road, Changping District, Beijing 102249, China; [email protected]
3Key Laboratory of Petroleum Engineering of China Ministry of Education, China University of Petroleum (Beijing), 18 Fuxue Road, Changping District, Beijing 102249, China; [email protected]
4School of Information Engineering, China University of Geosciences (Beijing), 29 Xueyuan Road, Haidian District, Beijing 100083, China; [email protected]
5Petroleum Systems Engineering, Faculty of Engineering and Applied Science, University of Regina, 3737 Wascana Parkway, Regina, Saskatchewan S4S 0A2, Canada; [email protected]
ABSTRACT
In this study, an integrated and practical framework has been developed to quantify the static and dynamic characteristics of microscopic pore-throat structure in a tight oil-bearing sandstone formation. Experimentally, thin sections were prepared out of core samples collected from a tight formation, and corresponding analyses were performed by using the scanning electron microscopy and x-ray diffraction techniques. In addition to pore types and clay minerals, the size, fraction, and distribution of grains were identified and classified. Pore and throat size distributions were then determined by using pressure-controlled mercury injection and rate-controlled mercury injection, respectively, to quantify the changes in microscopic pore-throat structure after brine-flow tests. Subsequently, displacement experiments of water flooding and surfactant flooding were performed to determine the upper and lower cutoff value of the movable throat radius. Rock grains primarily containing fine sand and silt were found to possess complex compositions, and both intergranular pores and intragranular dissolution pores were dominant. Nanothroats may have developed in a tight formation because of small radii of pores and throats. Compared with the pore size distribution, throat radius was found to be reduced by 13.9% after brine-flow tests, and the cutoff value of movable throat can be decreased to 0.019 from 0.033 μm by using a surfactant.
INTRODUCTION
Because of the escalating oil consumption and depletion of conventional oil reserves, the vast tight oil reserves have attracted much more attention recently, though it is challenging to effectively recover oil from such tight formations with extremely low permeability. Numerous efforts have been made to examine the effects of sedimentation and diagenetic alterations in tight formations (Lai et al., 2016; Zhou et al., 2016a). Physically, tight sandstones contain complex pore-throat structures, not only resulting in poor reservoir connectivity but also complicating oil recovery processes; pore-throat geometry controls the reservoir quality, and its changes affect production performance (Shanley and Cluff, 2015). A better understanding of petrophysical properties of tight oil reservoirs is essential for accurate reserve evaluation and successful field exploitation (Padhy et al., 2007; Song and Yang, 2017; Zhang et al., 2017). Therefore, it is of practical and fundamental importance to evaluate the static and dynamic characteristics of microscopic pore-throat structure in a tight formation and identify the underlying mechanisms associated with changes in reservoir properties.
In general, reservoir quality studies have examined the effects of sedimentation and diagenetic alterations. In addition to particle composition, lithofacies, tectonics, and diagenetic progress, pore-throat structure has recently been considered to be the dominant factor for reservoir quality and production performance (Zhang et al., 2009; Morad et al., 2010; Ozkan et al., 2011; Stroker et al., 2013; Xi et al., 2016). Traditionally, pore-throat structure can be examined either by direct methods or indirect methods. The former mainly uses thin-section analysis, scanning electron microscopy (SEM), and x-ray diffraction (XRD) to directly obtain information on pore, throat, pore-throat connectivity, and clay-mineral content. As for the latter, pressure-controlled mercury injection (PMI) and rate-controlled mercury injection (RMI) experiments are performed to measure the radius of pore and throat by monitoring and recording the mercury-intrusion saturation with pressure; moreover, RMI can be used to separate pore bodies from throats (Aguilera, 2002; Clarkson et al., 2013; Zhao et al., 2015). Because of the technical limitations of each individual method for examining pore-throat structure, an integrated technique will be developed to accurately identify the pore-throat structure together with its changes under reservoir conditions (Clarkson et al., 2012; Gao and Li, 2016).
In addition to evaluating how the fracturing affects the diagenesis and deliverability, Zhou et al. (2016a) investigated porosity and permeability as a function of diagenetic minerals and burial history in tight formations. It is well accepted that there is a poor correlation between porosity and permeability for tight reservoirs (Lai et al., 2013; Gao et al., 2015; Nieves et al., 2016). Xi et al. (2016) found that characteristics of pore size distribution for core samples with different porosities and permeabilities are similar; however, throat size together with the ratio of pore radius to throat radius is significantly different. Although numerous efforts have been made to identify the underlying mechanisms associated with changes in reservoir properties, no attempts have been directed to quantify the changes in the microscopic pore-throat structure in a tight formation during production processes (Zhu et al., 2004; Zhang and Yang, 2013, 2014; Tian et al., 2015; Zhang et al., 2016). After water flooding in conventional formations, it has been found that cementation materials are reduced, permeability is decreased, pore-throat connectivity is improved, and formation rocks are altered to be more hydrophilic (Xu and Li, 2003; Lin et al., 2008). Recently, dispersion and migration of clay minerals have been found to induce permeability damage in a tight formation, resulting in an increasing number of small throats caused by obstruction of some throats (Fang et al., 2016). Also, capillary pressure is an even more important factor in determining the ultimate hydrocarbon recovery in a tight formation (Donaldson et al., 1985; Manrique et al., 2007; Zhang et al., 2012, 2017; Zhang and Yang, 2013, 2014).
In this paper, an integrated and pragmatic technique was developed to experimentally quantify microscopic pore-throat structure and its dynamic characteristics in a tight sandstone formation. Thin-section analysis was conducted to directly identify pore types, distribution of clay minerals, particle composition, and grain size. Then, XRD and SEM tests were carried out to determine the type, fractionation, and distribution of clay minerals of rock samples. At the same time, PMI experiments with maximum injection pressure of 100 MPa (14,503.77 psi) were performed to quantify the pore-throat size distribution for the core plugs. Subsequently, RMI tests were conducted to not only distinguish pores from throats in a core plug but also characterize the pore-throat structure together with its changes after brine-flow tests. After water flooding, surfactant flooding experiments were further performed to determine the lower cutoff value of movable throat radius.
EXPERIMENTS
Materials
A total of 200 tight sandstone samples with gas permeability lower than 0.5 md were collected from the Upper Triassic Yanchang Formation of the Chang 7 tight oil reservoir in the Ordos Basin, China (see Figure 1). Cylindrical core samples were drilled parallel to the bedding from the collected full-size cores with no fractures or vugs. Two closely adjacent core plugs with a diameter of 25.4 mm (1.0 in.) and a length of more than 50.8 mm (2.0 in.) drilled from the same full-diameter core at the same depth along the same direction were used to minimize the inherent uncertainties in the aforementioned PMI, RMI, and SEM experiments with and without brine-flow tests. One such prepared core plug was cut into two or three with a length of 25.4 mm (1.0 in.) to perform PMI tests, RMI tests, and SEM analysis, respectively. The other was used to perform brine-flow tests, and then it was cut into two or three to respectively perform PMI tests, RMI tests, and SEM analysis once it was dried at 105°C for more than 8 hr. It is worthwhile to note that residual oil was removed from all the core samples, which were then dried for use. Research-grade helium and nitrogen with purity of 99.999 mol % were respectively used in porosity and permeability measurements.
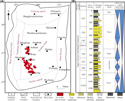 Figure 1. (A) Tectonic divisions and favorable tight oil targets in the Ordos basin and (B) stratigraphic column of Yanchang Formation (revised from Liu et al., 2015 and Wang et al., 2015 and used with permission of Petroleum Exploration and Development). Ch = Chang.
Kerosene with viscosity of 2.500 MPa·s and density of 774.0 kg/m3 (1706.4 lb/ft3) at 20°C and atmospheric pressure was used as oil phase to shorten stabilization time. Synthetic brine with 7.00 wt. % NaCl, 0.60 wt. % GaCl2, and 0.40 wt. % MgCl2 was prepared and used as reservoir brine. Density and viscosity of the synthetic brine were measured to be 1027.9 kg/m3 (2266.2 lb/ft3) and 0.894 MPa·s, respectively, at 20°C and atmospheric pressure. The interfacial tension between the synthetic brine and kerosene was measured to be 29.4 mN/m at 20°C and atmospheric pressure.
A liquid surfactant (i.e., carboxylic acid betaine amphoteric [EAO]) was used in the experiments. The surfactant solution was prepared by adding the EAO liquid directly into the filtered brine with a concentration of 0.4 vol. % while ensuring that the solution was stirred gently with a glass bar for even distribution. Then, the prepared solution was forced through a 3-μm filter to remove any possible impurities and microgels prior to displacement experiments. The interfacial tension between the surfactant solution and kerosene was measured to be 5.56 × 10⁻² mN/m at 20°C and atmospheric pressure.
Experimental Setup
Flow tests and displacement experiments were performed by using an experimental setup as shown in Figure 2, which consists of four subsystems: injection, displacement, production, and temperature control. In the fluid-injection subsystem, synthetic brine and surfactant solutions were respectively contained in two transfer cylinders, which were then injected into core samples with a high-pressure syringe pump (100 DX, ISCO Inc.). A core plug was horizontally placed in the coreholder (HZ-MX16s) with maximum operating pressure of 70 MPa (10,152.64 psi). Another high-pressure displacement pump (JB-II) was used to supply the confining pressure to the coreholder, where the confining pressure was usually 2.00 MPa (290.08 psi) higher than the inlet pressure. As for the production subsystem, the produced water and oil were collected by using a fine graduated cylinder. Constant experimental temperature was maintained by using an electric heating thermostat (WH-TH-408L), represented by the dashed box in Figure 2.
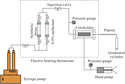 Figure 2. Schematic diagram of the experimental setup for brine-flow tests and displacement experiments.
Experimental Procedures
Prior to each experiment, porosity and permeability of all 200 core samples were measured. Porosity measurements were performed by using a porosimeter (HZ-K16) with a relative error of less than 2%. Permeability measurements were conducted at the steady state with nitrogen by using a gas–liquid displacement system (TY-4) with a relative error of less than 5%. The inlet and outlet pressures were set to be 0.35 MPa (51.76 psi) and 0.10 MPa (14.50 psi; i.e., atmospheric pressure), respectively, with a constant confining pressure of 2.35 MPa (340.84 psi).
Thin-Section Analysis
The 85 thin sections with a thickness of 0.03 mm were prepared and impregnated with blue or red epoxy resin by following the standard SY/T 5913-2004 (China National Petroleum Corporation, 2004) for petrographic analysis. A Nikon Eclipse LV100 POL polarizing microscope was then equipped to determine particle compositions by applying polarized and cross-polarized analysis. Pore types as well as distribution of clay minerals and grain size were observed and analyzed with the polarized light microscope.
X-Ray–Diffraction Analysis
After being air dried, saturated with ethylene glycol, and heated at 550°C for 2.5 hr, 110 core samples were selected for XRD analysis by using an x-ray diffractometer (D8 DISCOVER, Bruker Corporation) to quantify the clay mineralogy of the sandstones. According to the Stokes settlement theorem in fluid statics, clay minerals with particle size of less than 10 and less than 2 μm were extracted through centrifugal separation (China National Petroleum Corporation, 2010). Subsequently, the clay minerals with particle size of less than 10 μm were used to quantify the percentage of total clay minerals in the original formation rock, whereas those with particle size of less than 2 μm were used to determine the relative content of each clay mineral.
Scanning Electron Microscopy Analysis
The SEM analysis was performed to examine pore morphology and types, occurrence, and distribution of clay minerals of the freshly broken fragments; 17 samples were coated in gold and then examined using an FEI Quanta 200F scanning electron microscope at an accelerating voltage and resolution of 30 kV and 1.2 nm, respectively. Core samples were mechanically shattered, and then the freshly broken flat fragments were selected to be coated in gold and placed for secondary electron imaging and energy dispersive spectroscopy.
Brine-Flow Tests
The 10 dried core samples with different permeabilities were injected with brine of 100 pore volumes (PVs) to examine potential changes in the pore-throat structure induced by the injected brine. The synthetic brine was injected into the dried core samples with an injection pressure of 20 MPa (2900.75 psi) at a temperature of 65°C, which is identical with reservoir conditions. The experiment was terminated when the injection volume was equal to 100 PVs. Subsequently, the injected samples were dried again to measure their porosity and permeabilities. The PMI and RMI tests were performed to examine whether there were any changes in pore-throat structure relative to the adjacent samples, which were collected at the same depth and drilled along the same direction as those for brine injection to minimize the inherent uncertainties.
Pressure-Controlled Mercury Injection Experiments
A total of 20 PMI experiments were performed (i.e., 10 brine-flooded core samples and 10 samples without brine-flow test) with a mercury porosimeter (PoreMaster AutoPore IV 9500) by following the standard SY/T 5346-2005 (China National Petroleum Corporation, 2005). The diameters and lengths of the cylindrical core samples were all 25.4 mm (1.0 in.). The maximum mercury-intrusion pressure was set to be 100 MPa (14,503.77 psi), corresponding to a throat radius of 7.4 nm. The equilibrium time for each testing pressure was set to be 90 s, because the permeability was less than 0.5 md. After its highest value was reached, the operating pressure was gradually decreased, allowing the mercury to be extruded from the samples. Once the extrusion was completed, both mercury intrusion and extrusion curves were obtained. Surface tension of mercury (σ) is 0.48 N/m, and its contact angle (θ) is 140° (China National Petroleum Corporation, 2005). Consequently, the capillary-pressure curve can be converted into the curve of throat size versus saturation by using the equation (Tiab and Donaldson, 2004)
where  is capillary pressure (MPa) and
  is throat radius (μm).
Rate-Controlled Mercury Injection Experiments
The RMI experiments can be used to effectively distinguish a pore from a throat. In general, the RMI method uses a low constant flow rate to inject mercury into a rock sample without altering both interfacial tension and contact angle. The pressure is increased if mercury encounters a throat; otherwise, it is decreased if mercury enters a pore. Accordingly, a mercury pressure–volume curve can be recorded to obtain information with respect to pores and throats of a rock sample; 20 RMI tests were performed for 10 core samples before and after brine-flow tests with an ASPE-730 apparatus (Coretest System, Inc.). The maximum mercury injection pressures were measured to be from 4.552 MPa (660.21 psi) to 6.205 MPa (899.96 psi) for different samples, whereas the injection rate was maintained at 0.1 μl/min. The corresponding throat radius was found to be from 0.12 to 0.16 μm.
Displacement Experiments
Five core samples were first completely evacuated by using a vacuum pump, followed by injecting kerosene. Subsequently, the saturated core samples were displaced by synthetic brine with a constant injection pressure ranging from 10 MPa (1450.38 psi) to 12 MPa (1740.45 psi) at 65°C. When there was no kerosene produced, the displacement agent was switched from synthetic brine to the 0.4 vol. % surfactant solution with the same injection pressure. Finally, the experiment was terminated when no kerosene was produced.
Because of the length limit and aforementioned nonreusable core plugs, different experiments had to employ different samples. To ensure consistent results, all the core samples were carefully checked and selected for similar physical properties. To compare the characteristics of pore, throat, and clay minerals, 10 groups of 2 closely adjacent core plugs drilled from the same full-diameter core at the same depth along the same direction were used to perform PMI, RMI, and SEM experiments without and with brine-flow tests. Also, five long core plugs with different porosities and permeabilities were selected and cut into two pieces to carry out PMI tests and displacement experiments, respectively. Figure 3 illustrates the relationship associated with experimental procedure, testing number, and corresponding experiments.
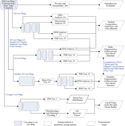 Figure 3. Relationship of experimental procedure, testing number, and corresponding experimental measurements obtained in this study. PMI = pressure-controlled mercury injection; RMI = rate-controlled mercury injection; SEM = scanning electron microscopy; XRD = x-ray diffraction.
RESULTS
Petrophysical Properties, Sandstone Texture, and Composition
Petrophysical Properties
As a whole, the reservoir qualities in the studied sandstones are quite poor. The permeabilities of 200 samples range from 0.005 to 0.963 md with an average of 0.158 md (see Figure 4A), and the corresponding porosities range from 4.86% to 15.95% with an average of 10.49% (see Figure 4B). Moreover, the core samples with the same porosity may have significantly different permeabilities (see Figure 4C). As can be seen from Figure 4C, it is evident that, although there is generally a positive correlation between permeability and porosity, the permeability of this tight sandstone reservoir is not controlled by porosity.
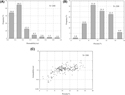 Figure 4. The reservoir property characteristics of studied tight sandstones: (A) permeability distribution, (B) porosity distribution, and (C) correlation between porosity and permeability. N = number of core samples.
Particle Composition and Grain Size
The studied sandstone in the Chang 7 reservoir is classified mainly as arkoses and lithic arkoses according to Folk’s classification scheme (Folk, 1980) (see Figure 5). As shown in Figure 6A, B, detrital mineralogy mostly consists of quartz, feldspar, and rock fragments (i.e., igneous, metamorphic, and sedimentary grains). Quartz ranges from 25.0% to 43.0% with an average of 34.1%. Feldspar content ranges from 30.0% to 45.0% with an average of 37.3%, including both plagioclase and K-feldspar. Rock fragments range from 4.0% to 32.0% with an average of 19.0%, in which metamorphic rock fragments take up to 19.9% with an average of 13.5%.
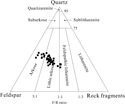 Figure 5. Detrital composition of studied tight sandstones plotted on the classification triangle of Folk (1980). F/R ratio = feldspar content/rock fragment content.
 Figure 6. Photomicrographs showing sedimentary and diagenetic minerals in studied tight sandstones. (A) Plane-polarized light (PPL) image showing sandstone compositions. Particle composition was mainly composed of quartz (Q; 34.0%) and feldspar (F; 23.5%). Rock fragments (RF) include igneous (extrusive rock only: 5.7%), metamorphic (including Q, schist, phyllite, and slate: 18.5%), and sedimentary RF (mica only: 1.8%) (EY37, nitrogen permeability [kg] = 0.082 md, porosity [φ] = 7.63%). (B) A PPL image showing clay minerals attached to the surface of the pore and throat (EYU28, kg = 0.130 md, φ = 11.75%). (C) Scanning electron microscopy (SEM) image showing bent-sheet-shaped, flocculent mixed-layer illite–smectite (I/S) and illite (I) between rock grains and on grain surfaces (EYU28, kg = 0.130 md, φ = 11.75%). (D) An SEM image showing pore lining with leaf-shaped chlorite (Chl) and authigenic microquartz (AQ) filled in the intergranular pores (EY37, kg = 0.082 md, φ = 7.63%). (E) An SEM image showing filamentous I were filled in the throat (EH20, kg = 0.111 md, φ = 9.36%). (F) An SEM image showing intergranular plate-shaped and sheet-shaped kaolinite (K; EY38, kg = 0.105 md, φ = 8.38%). Ca = calcite.
As illustrated in Figure 7, thin-section images confirm that the rock grain sizes mainly are in the range from 0.04 to 0.42 mm with a mean size of 0.18 mm; the sedimentary grains are mostly composed of fine sand and are moderately well to well sorted. The grain texture is mainly subangular and subrounded (see Figure 6A, B). The extensive planar and concave–convex grain contacts, combined with deformation of micas and mud intraclasts, suggest that mechanical compaction may have been a significant factor in the destruction of pore-throat structure.
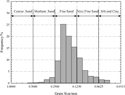 Figure 7. The grain-size distribution plotted on the Udden–Wentworth scale (Boggs, 2009).
Clay Minerals
As shown in Figure 6B, clay minerals are widely distributed in pores and throats. According to the thin-section analysis, XRD clay quantitative analysis, and SEM analysis, total clay content ranges from 10.8% to 26.9% with an average of 17.4%. Chlorite with a mean relative content of 41.0% (ranging from 25.0% to 70.0%) and mixed-layer illite–smectite with a mean relative content of 42.0% (ranging from 24.0% to 62.0%) presented in all samples account for the highest clay composition, whereas mixed-layer illite–smectite contains 15.0%–20.0% smectite. Illite with a mean relative content of 9.0% (ranging from 6.0% to 13.0%) is also observed in all the samples, whereas kaolinite is in part of the samples.
Mixed-layer illite–smectite minerals (see Figure 6C) are intermediate products formed through the transformation of smectite to illite and chlorite, in which the measured percentage of smectite is less than 25.0%, indicating a late diagenetic stage (Liu et al., 2009). Chlorite is highly developed and mainly exists as leaf-shaped minerals found among grains and on grain surfaces (see Figure 6D). Moreover, chlorite is adsorbed to the pore walls as thin films and thus decreases pore size, which negatively influences the pore-throat structure. Illite is mainly presented in the mixed-layer illite–smectite; it is seldom developed independently and typically occurs in a filamentous form as shown in Figure 6E. Kaolinite, which normally results from the erosion of feldspar and other silicate minerals, is found in few samples as intergranular plate-shaped and sheet-shaped forms and fills pores (see Figure 6F).
Pore and Throat Size Distribution
Pore Types
As mentioned previously, because of the high level of diagenesis (i.e., a late diagenetic stage), the constructive diagenesis mainly involves dissolution, and the destructive diagenesis primarily involves compaction and cementation. As can be seen from Figure 8, total thin-section porosity of the sandstones ranges from 0.9% to 2.3% with an average of 1.7%. Intergranular pore, presented in Figure 9A, B, accounts for 44.97% of thin-section porosity. Because of previous diagenetic compaction and authigenic cementation, most of the primary intergranular pores disappear. As such, the remaining pores are mostly residual pores that have not been completely filled with heterogeneous and authigenic cementation materials. The pores gradually became triangular or polygonal with the dimensions of approximately 20–300 μm.
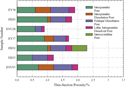 Figure 8. Thin-section porosity of pore types obtained.
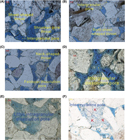 Figure 9. Typical pore occurrence types and throat types in studied tight sandstone. (A) Plane-polarized light (PPL) image showing intergranular pore, shrunken pore, and sheet-shaped throat (EYU28, nitrogen permeability [kg] = 0.130 md, porosity [φ] = 11.75%). (B) A PPL image showing intergranular pore and bent-sheet-shaped throat (EY38, kg = 0.105 md, φ = 8.38%). (C) A PPL image showing feldspar dissolution pore and neck-shaped throat (EYU28, kg = 0.130 md, φ = 11.75%). (D) A PPL image showing intergranular dissolution pore (EH20, kg = 0.111 md, φ = 9.36%). (E) A PPL image showing lithic intragranular dissolution pore (EH20, kg = 0.111 md, φ = 9.36%). (F) A PPL image showing intercrystalline pore (EH21, kg = 0.101 md, φ = 9.45%). K = kaolinite.
As a result of selective dissolution along unstable cleavage planes and fracture planes, feldspar dissolution pores are highly developed, accounting for 27.81% of the total thin-section porosity. As can be seen in Figure 9C, a feldspar dissolution pore exhibits an irregular grid, honeycomb, or stripe shape, although it still looks like the short columnar crystals of its original feldspar grains. The size of the feldspar dissolution pore is typically from 5 to 50 μm, with relatively poor connectivity between pores; however, some pores formed by complete feldspar dissolution are larger than 100 μm. Intergranular dissolution pores are also found (see Figure 9D) and account for 11.76% of the total thin-section porosity. Such pores are frequently developed together with feldspar dissolution pores because organic acid, which was formed through kerogen decarboxylation, eroded carbonate salts and clay minerals (Xie et al., 2010); they are extremely small in size, mainly approximately 10 μm.
Compared with the aforementioned pore types, lithic intragranular dissolution pores are less common and are primarily formed when dissoluble components within rock-fragment grains undergo selective dissolution, forming honeycomb-shaped pores (see Figure 9E). When a rock-fragment grain is completely dissolved, silklike residuals form the contour of the original grain, resulting in large pores with the size of more than 150 μm that markedly surpass their neighboring grains in size. Only few samples contain intercrystalline pores (see Figure 9F), which mainly consist of pores between crystalline bodies such as kaolinite and mica as well as residual pores formed when secondary quartz crystals enlarge and fill primary pores.
Throat Characteristics
The size and shape of a throat are mainly determined by the grain shape, size, contact, and cementation type. There exist shrunken pore throats (Figure 9A), neck-shaped throats (Figure 9C), sheet-shaped or bent-sheet-shaped throats (Figure 9A, B), and tube-shaped throats in the studied tight sandstone. Because of the fine and very fine grain size, mechanical compaction, and cementation, most throats are transformed from primary shrunken pore throats and neck-shaped throats to sheet-shaped and bent-sheet–shaped throats, indicating a serious deterioration of connectivity of pores. If a primary intergranular pore is almost completely filled with cements, the micropores in the cements would form a tube-shaped throat.
Rate-Controlled Mercury Injection Tests
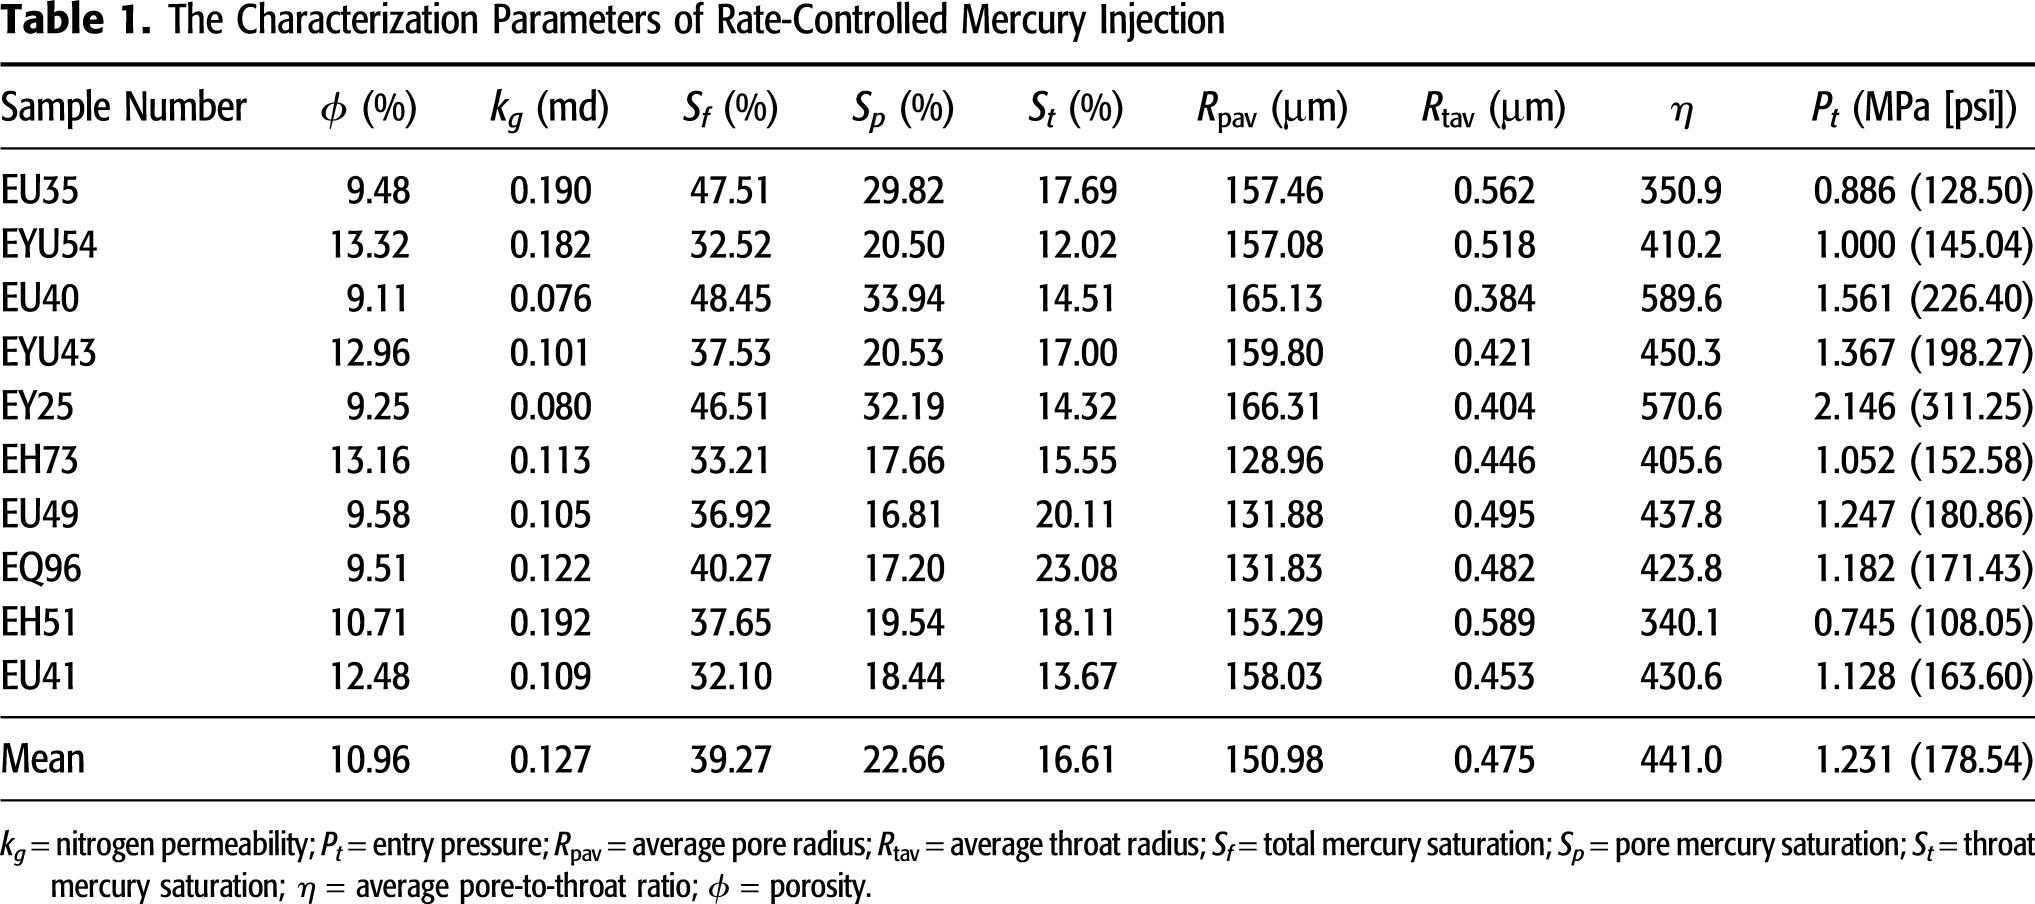
Although only large throats and their connected pores can be measured because of a low mercury injection pressure, RMI experiments are conducted to separate pores from throats, allowing us to determine pore radius and throat radius (Zhao et al., 2015; Zhu et al., 2015). The mercury injection pressure as a function of its saturation for 3 typical samples with different porosities and permeabilities during RMI experiments is depicted in Figure 10, and the corresponding characteristic properties that are extracted by using RMI experiments for 10 samples are listed in Table 1. The average pore radius ranges from 128.96 to 166.31 μm with an average value of 150.98 μm, whereas the average throat radius ranges from 0.384 to 0.589 μm with a mean value of 0.475 μm (Table 1). The average pore-to-throat ratio, which is defined as the average ratio of pore radius to throat radius under the same capillary entry pressure, ranges from 340.1 to 589.6 with a mean of 441.0.
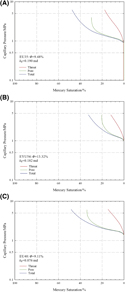 Figure 10. Rate-controlled mercury-intrusion curves of three samples: (A) EU35, (B) EYU54, and (C) EU40. kg = nitrogen permeability; φ = porosity.
The pore and throat sizes as well as pore-to-throat ratio distribution curves of typical samples derived from the RMI testing are illustrated in Figure 11. Although the porosities and permeabilities are different, all three samples exhibit normal distributions for pore radii within the range of 100–250 μm, and their maximum frequencies are located at approximately 150 μm (see Figure 11A), which agrees with the aforementioned thin-section and SEM results. The throat size distribution ranging from 0.12 to 1.0 μm shows a different Gaussian distribution (see Figure 11B). The throat radius is found to decrease with permeability. This finding might be helpful for identifying the controlling parameter of permeability in a tight sandstone. Figure 11C illustrates the pore-to-throat ratios with a single-peak distribution. Sample EU40 with the largest pore-to-throat ratio distribution is characterized by the lowest permeability. By contrast, the relationship between pore-to-throat ratio and permeability of sample EU35 is the opposite to that of sample EU40. According to the experimental measurements listed in Table 1 together with Figure 11, core samples with various permeabilities have similar pore radius distributions but different throat size distributions.
 Figure 11. Pore size, throat size, and pore-to-throat ratio distribution by rate-controlled mercury injection for the samples with different porosities and permeabilities. (A) Pore size distribution. (B) Throat size distribution. (C) Pore-to-throat ratio distribution. kg = nitrogen permeability; φ = porosity.
Pressure-Controlled Mercury Injection Tests
Capillary-pressure curves including intrusion and extrusion curves for four typical samples measured during PMI experiments with the maximum mercury injection pressure of 100 MPa (14,503.77 psi) are plotted in Figure 12A. For the samples with entry pressures (i.e., the point on the curve where the mercury is first injected into the rock) lower than 1.6 MPa (232.06 psi), the mercury-intrusion curves have a flat stage at the early period of the mercury intrusion. This finding is consistent with the RMI measurements. Furthermore, the samples with lower entry pressures have large maximum mercury-intrusion saturations and residual mercury saturations. The mercury-intrusion saturation can be as high as 90% (see Figure 12B), whereas the residual mercury saturation is higher than 50% and the mercury withdrawal efficiency (which is defined as the ratio of the volume of mercury that has been withdrawn from the core after the depressurization to the volume of mercury that had been injected into the core before the depressurization [Wardlaw and Taylor, 1976]) remains low, with an average of 27.19% (see Figure 12C). This indicates that fine throats dominate the fluid saturation in the studied tight sandstone.
 Figure 12. Capillary-pressure curves and throat characteristics based on pressure-controlled mercury injection experiments. The “frequency” on the y-axis (B–D) represents the sample ratio of each interval. (A) Intrusion and extrusion curves. (B) Maximum intrusion mercury saturation distribution. (C) Mercury withdrawal efficiency distribution. (D) Average throat radius distribution. kg = nitrogen permeability; N = number of core samples; φ = porosity.
Based on PMI capillary-pressure curves, throat radius can be calculated by using the correlation between throat radius and corresponding pore and throat volume determined by the specific throat radius as well as mercury injection pressure (Li et al., 2015; Zhu et al., 2015). The average value of throat radii ranges from 0.074 to 0.623 μm, and the most frequent throat radii are mainly between 0.15 and 0.35 μm (see Figure 12D), whereas the maximum throat radius ranges from 0.50 to 2.16 μm with nonuniform frequency distribution (Li et al., 2015; Zhu et al., 2015).
Combination of Rate-Controlled Mercury Injection and Pressure-Controlled Mercury Injection Tests
As shown above, RMI tests are able to characterize the large throats and pores that are connected by the throats, but they cannot identify throats smaller than 0.12 μm. However, PMI tests can be used to characterize throats for a wide range because of very high mercury injection pressure, though they fail to distinguish the pore sizes. Therefore, it is helpful to observe a wider size distribution of throat by combining RMI and PMI results (see Figure 13).
 Figure 13. Capillary-pressure curves and pore-throat size distribution by the combination of pressure-controlled mercury injection (PMI) and rate-controlled mercury injection (RMI). (A) Capillary-pressure curves by the comparison of PMI and RMI. (B) Pore size distribution by RMI. (C) Throat grading and overall throat size distribution by combination of PMI and RMI. kg = nitrogen permeability; φ = porosity.
Figure 13A illustrates the comparison of capillary-pressure curves of RMI and PMI experiments. Because of the change of contact angle at a high intrusion velocity of the PMI (Xi et al., 2016), the total mercury-intrusion saturation of RMI tests is always higher than that of the PMI tests at the same injection pressure. The RMI test is mainly accomplished under the conditions of constant contact angle and interfacial tension because of the quasistatic constant intrusion velocity of 0.1 μl/min, resulting in more accurate and reliable measurements. Therefore, RMI tests may be used in the overlapping part of the scale ranges, and they also may be used to calibrate the PMI results.
The pore size distribution curve and the overall throat size distribution curve that combines RMI and PMI results are shown in Figure 13B, C, respectively. The pore size distribution curve illustrates the correlation between pore frequency and the corresponding pore radius; however, the throat size distribution curve demonstrates the correlation between throat radius and total saturation, which includes pore and throat. According to the throat-grading standard of the Yanchang Formation in the Ordos Basin established by Ran et al. (2013), although the peak value of throat size distribution lies in the range of the microfine throat type, the saturation controlled by microfine throats, fine throats, and midthroats accounts for only approximately 36% (see Figure 13C). The highest saturation, accounting for approximately 60%, is connected by microthroats with radii smaller than 0.2 μm. This might be an indication that the subsequent surfactant flooding techniques in tight sandstone reservoirs effectively lower the cutoff value of movable throat radius.
Change of Pore-Throat Structure after Brine-Flow Tests
The decrease of permeability after brine-flow tests is an indication of changes in pore-throat structure; however, the porosities before and after brine-flow tests remain almost unchanged. As depicted in Figure 14, the permeabilities of all 10 core samples from brine-flow tests have been significantly reduced by 7.9%–23.7% with an average value of 13.9%. Such reduction may be caused by the decrease or shrinkage of the throats that act as fluid-flow channels in rock.
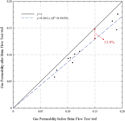 Figure 14. Changes in gas permeability before and after brine-flow tests. R2 = coefficient of determination; x = gas permeability before brine flow test; y = gas permeability after brine flow test.
The PMI and RMI test results for the samples from brine-flow tests show the basically unchanged pore size distribution and obviously changed throat size distribution. Figure 15A shows the similar pore size distribution curves before and after brine-flow tests, whereas the throat-radius distribution curves are shifted toward the left as shown in Figure 15B. Although the peak frequency value in the throat size distribution curve of sample EYU54 is found to remain nearly unchanged at 25%, the throat radius at maximum frequency decreases from 0.6 to 0.4 μm. The results of 10 core samples tabulated in Table 2 show that the mean value of throat radii with maximum frequency decreases from 0.5 to 0.3 μm; however, the mean maximum frequency increases from 26.62% to 31.40%.
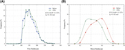 Figure 15. Pore size and throat size distributions before and after brine-flow tests. (A) Pore size distribution curves. (B) Throat size distribution curves. kg = nitrogen permeability; φ = porosity.

Displacement Experiments
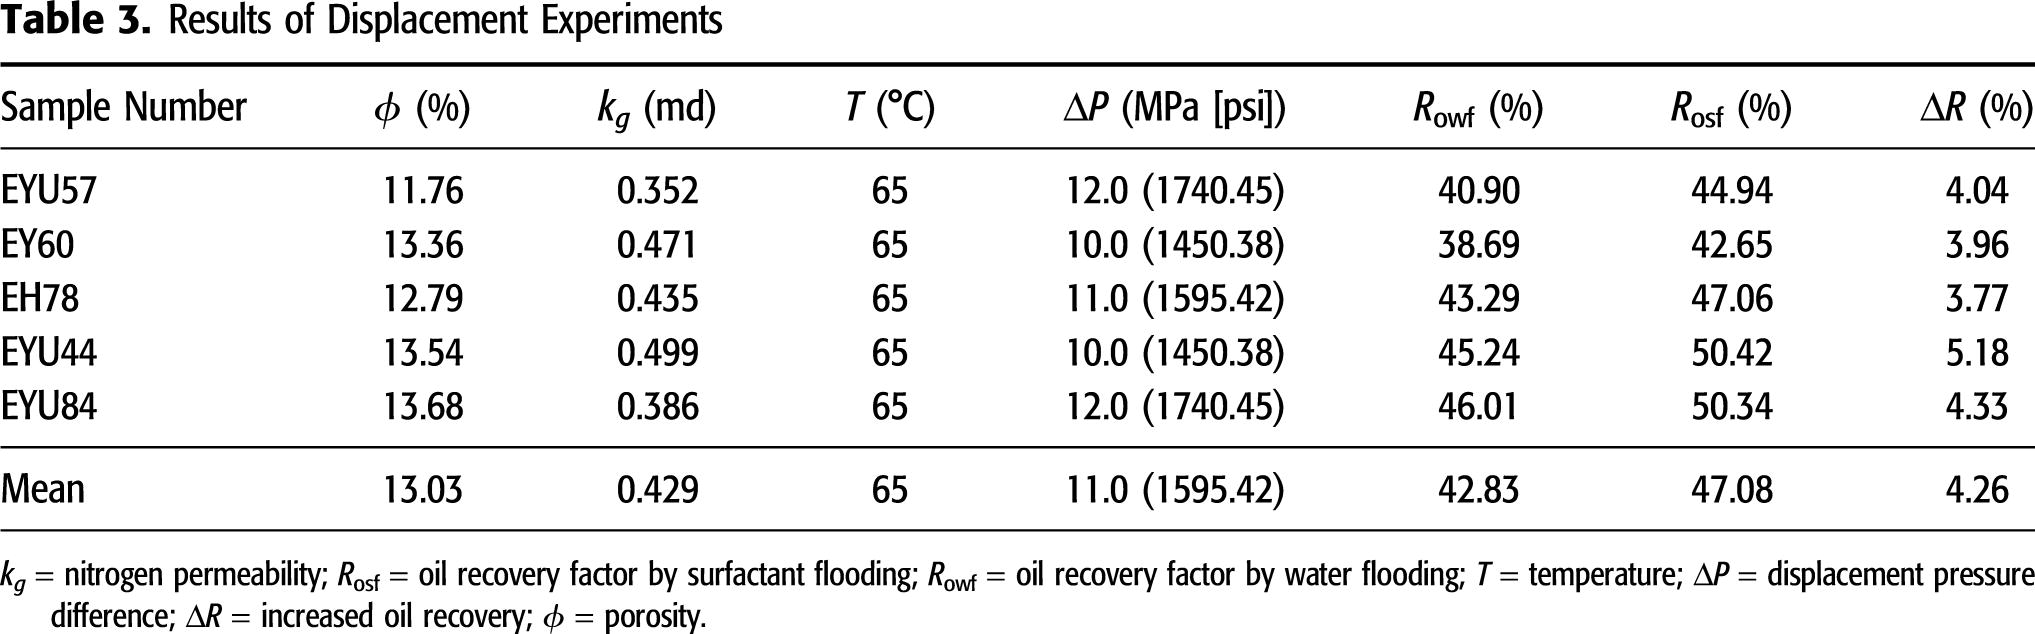
Figure 16 illustrates the oil recovery factor (which is the ratio of oil that has been recovered from the core sample by water flooding or surfactant flooding process to the original oil in place) with the injected volume of displacement agents for sample EYU57. The oil recovery factor reaches its plateau after 2.67 PVs of brine injection. Subsequently, the displacement agent is switched from brine to surfactant with a lower interfacial tension between the surfactant solution and kerosene. Because of the low interfacial tension and thus low capillary pressure, surfactant flooding can produce more oil from core samples by lowering the cutoff value of movable throat radius. As tabulated in Table 3, five core samples have been used for conducting the displacement experiments. The oil recovery factor after the surfactant flooding can be increased to 5.18% with an average of 4.26%, indicating that the surfactant is able to enter the pores controlled by smaller throats because of a reduction in the oil–water interfacial tension, thus displacing considerably more oil out of the core samples.
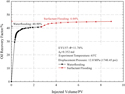 Figure 16. Oil recovery factor as a function of the injected volume of displacement agents. kg = nitrogen permeability; PV = pore volume; φ = porosity.
DISCUSSION
Deterioration of Pore-Throat Structure
The deterioration of pore-throat structure is mainly manifested by the shrinkage or blockage of larger throats with their radii of more than 0.5 μm. Figure 17 provides the relationship between saturation and throat size before and after brine-flow tests for sample EYU54. Combining the results shown in Figure 15 and Table 2, it can be found that changes in throat size distribution are mainly characterized by the following three aspects.
1. The radii of larger throats decreased. As illustrated in Figure 15A, B, there is almost no change in pore size distribution before and after brine-flow tests, but the throat size frequency distribution changes significantly. Both the decrease and shrinkage of the throat size result in the reduction of frequency of larger throats and the corresponding increase in frequency of smaller throats (see Figure 15B). Comparison between the saturation profiles shows a saturation increase to 2.68% controlled by throats with a radius of 0.7 μm and a saturation reduction to 4.44% controlled by throats with a radius of 1.0 μm, indicating the shrinkage of some throats (see Figure 17).
2. Some throats were blocked. The cumulative mercury saturation decreases from 93.10% before brine-flow tests to 89.42% after brine-flow tests, indicating some loss of throat caused by blockage (see Figure 17).
3. Changes mainly occurred in the larger throats. The saturation controlled by microfine throats and microthroats with radii smaller than 0.5 μm remains almost unchanged, because the saturation only changes from 39.53% to 38.74%; however, the saturation controlled by the larger throats with radii of 0.5 to 1.5 μm decreases from 52.35% to 49.98%. In addition, the larger throats have the largest permeability contribution coefficients (see equation 2), because they provide the main flow channels.
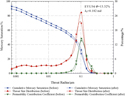 Figure 17. The contribution of throats of different sizes before and after brine-flow tests. kg = nitrogen permeability; φ = porosity.
The clay minerals are considered to be the primary factor causing the change of the throat size distribution in this tight sandstone. It is well known that pore-throat structure and corresponding reservoir quality are the cumulative expressions of several depositional attributes, subsequent diagenetic modifications, and the generation of secondary porosity (Nguyen et al., 2013; Lai et al., 2016). The types, occurrence, and distribution of authigenic minerals are considered to be important factors in porosity, pore and throat size reduction, and transferal of initial pore to intergranular pore (Bjørlykke, 2014). As a result of collecting them from the same formation, all core plugs in this study not only have the same sedimentary conditions of fine-grained lake deposition (Yang et al., 2016) but also experience the same subsequent compaction process. Meanwhile, the same confining and injection pressures are applied during the experiments to eliminate the interference of stress sensitivity. Therefore, the cementation during the diagenesis stage and the swelling and migration during the brine-flow tests are identified as key factors in heterogeneity and changes of pore throat and the corresponding permeability. For example, the kaolinite that is attached to the particle surface (see Figure 6F) can shatter and migrate during the fluid flow, whereas the original throat (see Figure 18A) would be blocked by such shattered kaolinite, and thus the permeability would be decreased (see Figure 18B). As shown in Figure 19, permeability and porosity decrease with an increase in clay-mineral content. This is mainly because clay minerals can precipitate as cementation materials in pores and throats, thus decreasing their radii and even obstructing the throats (Wilson, 1982).
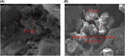 Figure 18. Photomicrographs showing the shattered and migrated kaolinite to block throats. (A) Scanning electron microscopy (SEM) image showing throats before brine-flow test (EU35, nitrogen permeability [kg] = 0.190 md, porosity [φ] = 9.48%). (B) An SEM image showing throats blocked by shattered and migrated kaolinite (EU35, kg = 0.147 md, φ = 9.47%).
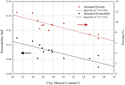 Figure 19. Permeability and porosity as a function of clay-mineral content. R2 = coefficient of determination.
The high clay-mineral content of 17.4% indicates the potential reservoir damage during fluid-flow processes. In this study, authigenic clay minerals are mainly composed of chlorite, mixed-layer illite–smectite, and illite, but kaolinite is also found in some samples. The chlorite membrane, which contains iron, can be dissolved in acidic conditions, and the subsequent precipitation can reduce the flow capacity of throats (Zhou et al., 2016b). As intermediate products that formed through the transformation of smectite to illite and chlorite, mixed-layer illite–smectite minerals are found to be chemically active, which may induce certain changes in a reservoir (Xu and Ding, 2009). The pressure of filamentous illite frequently results in a decreased pore-throat radius and high irreducible water saturation, inducing a large decrease in permeability (Lander and Bonnell, 2010). However, fine illite grains transported by water flow can obstruct pore-throat connections (Kantorowicz, 1990). The swelling and migration of clay minerals lead to deterioration of pore-throat structure and thus poor pore connectivity and lower permeabilities (Ajdukiewicz and Lander, 2010; Fang et al., 2016; Liu et al., 2016).
Control of Throat Size over Permeability
Pores are considered as the main storage space, whereas throat size and its distribution are the key factors in controlling tight sandstone permeability. As listed in Table 1, the mercury saturation in the pores accounts for 57.88% of its total mercury saturation on average, and it is moderately larger than that in the throats. As total mercury saturation increases, the proportion of mercury saturation in the pores also increases. The consistency of pore-size distributions before and after brine-flow tests shown in Figure 15 means that the pores may not be the key factor to control the flow properties of the tight sandstones. Compared with conventional reservoirs (Zhao et al., 2015), tight sandstone has a wide distribution of pore-to-throat ratio with an average of 441.0 (see Table 1), which not only indicates that each pore is controlled by a few small throats but also results in low pore connectivity, thus inducing the low recovery (Wang et al., 2009). Under high pressure, mercury-intrusion saturation can be as high as 90.00%, but the mercury withdrawal efficiency remains low with an average of 29.57%, indicating the existence of numerous nanothroats (Loucks et al., 2012). Such nanothroats result in poor reservoir connectivity and impede the injected mercury being drained out (Yang et al., 2013). This finding is consistent with those in unconventional sandstone reservoirs documented in the literature (Rezaee et al., 2012; Hinai et al., 2014; Xi et al., 2016). Average throat radius and permeabilities before and after brine-flow tests can be directly correlated with coefficient of determination (R2) = 0.7815 (see Figure 20A), whereas permeability is negatively correlated with the average pore-to-throat ratio (see Figure 20B). It can be concluded that complex pore-throat structure and nanothroats resulting from complex particle compositions, fine grain size, and high clay content have a significant impact on poor pore connectivity and low permeability in the studied tight sandstone.
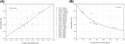 Figure 20. Throat-size controls on tight sandstone permeability. (A) Permeability as a function of average throat radius before and after brine-flow tests. (B) Permeability as a function of average pore-to-throat ratio. R2 = coefficient of determination.
Larger throats in the studied sandstone contribute to most of the permeability; meanwhile, smaller throats contribute to most of the porosity. A permeability contribution coefficient is used to quantify the effect of different sizes of throats in a reservoir seepage process by using the equation (Zhu et al., 2016)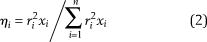
where  is throat radius (μm),
  is distribution frequency of
  (%), and
  is permeability contribution coefficient. As can be seen from the permeability-contribution-coefficient curve of sample EU35 in Figure 21, the permeability contribution coefficient reaches 80.2% for throats with radii larger than 0.353 μm; however, such throats only control the saturation of 13.5%. This clearly illustrates that a few relatively larger throats contribute to the highest permeability of 80%; however, they have a very small porosity contribution of 14%.
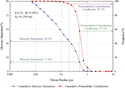 Figure 21. Cumulative permeability contribution coefficient and cumulative mercury saturation as a function of throat radius. kg = nitrogen permeability; φ = porosity.
Cutoff Value of the Movable Throat Radius
To efficiently exploit tight oil formations, it is important to lower the cutoff value of the movable throat radius. In the past 10 yr, horizontal wells and multistage hydraulic fracturing technologies have improved tight oil production, but the primary oil recovery factor is still very low because of the extremely tight nature (Yu et al., 2015). Although water flooding has been widely used for tight oil production in the Ordos Basin, it is important to lower the cutoff value of movable throat radius to improve production performance. The displacement strategies, such as CO2 flooding (Pu et al., 2016), water-alternating CO2 (Yang et al., 2015), surfactant flooding (Yu and Su, 2015; Barati-Harooni et al., 2016), and hot-water flooding (Yang, 2013), have been evaluated for such a purpose.
As shown in Figure 22, the cutoff values of movable throat radius can be defined as the minimum throat radius in which the fluid can flow overcoming the capillary force under the conditions of water flooding and surfactant flooding, respectively (Li et al., 2015). When kerosene that is saturated in the oil-wet cores is displaced by the displacement agent, a kerosene film is formed resulting from the viscous force, and then its thickness can be calculated by using the equation (Mo et al., 2015)
where  is thickness of kerosene film (μm),
  is capillary radius (μm),
  is pressure gradient (MPa/m), and
  is viscosity of kerosene (MPa·s). Based on average capillary radius and the corresponding kerosene film thickness, capillary displacement efficiency is calculated to be 60.02%. This means that 60.02% of kerosene has been displaced by the displacement agent in the throats and pores where fluids can flow and overcome the capillary force. According to the oil recovery factors of 45.24% and 50.42% using displacement agents of synthetic brine and surfactant, the corresponding controlled porosities are calculated to be 75.40% and 84.03%, respectively. The corresponding cutoff value of movable throat radius for sample EYU44 is then decreased from 0.033 to 0.019 μm, leading to an increase of oil recovery factor of 5.18%.
 Figure 22. The cutoff values of movable throat radius using different displacement agents. kg = nitrogen permeability; φ = porosity.
CONCLUSIONS
An integrated and practical technique was developed to determine static and dynamic characteristics of microscopic pore-throat structure in a tight oil-bearing sandstone formation. For tight sandstone core samples with different permeabilities, the pore size distribution with normal distribution is similar, but different throat size distribution resulted from complex particle composition, fine grain size, tight cementation, and high clay content, mainly composed of mixed-layer illite–smectite and chlorite. Throats with small average radii are found to have a major impact on poor pore connectivity and low permeability. Throats with a radius greater than 0.2 μm only control the porosity of less than 40% but contribute to permeability most by more than 95%. The dynamic change of microscopic pore-throat structure can be characterized by the blockage and shrinkage of larger throats caused by both the swelling of clay minerals and the deterioration of pore-throat structure. After brine-flow tests, the pore size distribution remains almost unchanged; however, the average throat radius with maximum frequency in throat size distribution curve decreases from 0.5 to 0.3 μm, and the average permeability decreases by 13.9%. By using surfactants, the cutoff value of movable throat radius in this tight sandstone can be decreased to 0.019 from 0.033 μm when brine is used, leading to an incremental oil recovery of 4.26%.
REFERENCES CITED
Aguilera, R., 2002, Incorporating capillary pressure, pore throat aperture radii, height above free-water table, and Winland r35 values on Pickett plots: AAPG Bulletin, v. 86, no. 4, p. 605–624, doi:10.1306/61EEDB5C-173E-11D7-8645000102C1865D.
Ajdukiewicz, J. M., and R. H. Lander, 2010, Sandstone reservoir quality prediction: The state of the art: AAPG Bulletin, v. 94, no. 8, p. 1083–1091, doi:10.1306/intro060110.
Barati-Harooni, A., A. Najafi-Marghmaleki, A. Tatar, and A. H. Mohammadi, 2016, Experimental and modeling studies on adsorption of a nonionic surfactant on sandstone minerals in enhanced oil recovery process with surfactant flooding: Journal of Molecular Liquids, v. 220, p. 1022–1032, doi:10.1016/j.molliq.2016.04.090.
Bjørlykke, K., 2014, Relationships between depositional environments, burial history and rock properties. Some principal aspects of diagenetic process in sedimentary basins: Sedimentary Geology, v. 301, p. 1–14, doi:10.1016/j.sedgeo.2013.12.002.
Boggs, S., 2009, Petrology of sedimentary rocks, 2nd ed.: Cambridge, United Kingdom, Cambridge University Press, 600 p.
China National Petroleum Corporation, 2004, Rock thin section preparation, SY/T 5913-2004 oil and gas industry standard of the People’s Republic of China: Beijing, China, Petroleum Industry Press, 9 p.
China National Petroleum Corporation, 2005, Rock capillary pressure measurement, SY/T 5346-2005 oil and gas industry standard of the People’s Republic of China: Beijing, China, Petroleum Industry Press, 17 p.
China National Petroleum Corporation, 2010, Analysis method for clay minerals and ordinary non-clay minerals in sedimentary rocks by the x-ray diffraction, SY/T 5163-2010 oil and gas industry standard of the People’s Republic of China: Beijing, China, Petroleum Industry Press, 43 p.
Clarkson, C. R., J. L. Jensen, P. K. Pedersen, and M. Freeman, 2012, Innovative methods for flow-unit and pore-structure analyses in a tight siltstone and shale gas reservoir: AAPG Bulletin, v. 96, no. 2, p. 355–374, doi:10.1306/05181110171.
Clarkson, C. R., N. Solano, R. M. Bustin, A. M. M. Bustin, G. R. L. Chalmers, L. He, Y. B. Melnichenko, A. P. Radliński, and T. P. Blach, 2013, Pore structure characterization of North American shale gas reservoirs using USANS/SANS, gas adsorption, and mercury intrusion: Fuel, v. 103, p. 606–616, doi:10.1016/j.fuel.2012.06.119.
Donaldson, E. C., G. V. Chilingarian, and T. F. Yen, 1985, Enhanced oil recovery, 1: Fundamentals and analysis: New York, Elsevier Science, 356 p.
Fang, W. C., H. Q. Jiang, J. Li, W. Li, J. J. Li, L. Zhao, and X. N. Feng, 2016, A new experimental methodology to investigate formation damage in clay-bearing reservoirs: Journal of Petroleum Science Engineering, v. 143, p. 226–234, doi:10.1016/j.petrol.2016.02.023.
Folk, R. L., 1980, Petrology of sedimentary rocks: Austin, Texas, Hemphill Publishing Company, 184 p.
Gao, H., and H. A. Li, 2016, Pore structure characterization, permeability evaluation and enhanced gas recovery techniques of tight gas sandstones: Journal of Natural Gas Science and Engineering, v. 28, p. 536–547, doi:10.1016/j.jngse.2015.12.018.
Gao, H., T. T. Li, and L. Yang, 2015, Quantitative determination of pore and throat parameters in tight oil reservoir using constant rate mercury intrusion technique: Journal of Petroleum Exploration and Production Technology, v. 6, no. 2, p. 309–318, doi:10.1007/s13202-015-0186-6.
Hinai, A. A., R. Rezaee, L. Esteban, and M. Labani, 2014, Comparisons of pore size distribution: A case from the Western Australian gas shale formations: Journal of Unconventional Oil and Gas Resources, v. 8, p. 1–13, doi:10.1016/j.juogr.2014.06.002.
Kantorowicz, J. D., 1990, The influence of variations in illite morphology on the permeability of Middle Jurassic Brent Group sandstones, Cormorant field, UK North Sea: Marine and Petroleum Geology, v. 7, no. 1, p. 66–74, doi:10.1016/0264-8172(90)90057-N.
Lai, J., G. W. Wang, M. Chen, S. N. Wang, Y. Chai, C. Cai, Y. C. Zhang, and J. L. Li, 2013, Pore structures evaluation of low permeability clastic reservoirs based on petrophysical facies: A case study on Chang 8 reservoir in the Jiyuan region, Ordos Basin: Petroleum Exploration and Development, v. 40, no. 5, p. 606–614, doi:10.1016/S1876-3804(13)60079-8.
Lai, J., G. W. Wang, Y. Ran, Z. L. Zhou, and Y. F. Cui, 2016, Impact of diagenesis on the reservoir quality of tight oil sandstones: The case of Upper Triassic Yanchang Formation Chang 7 oil layers in Ordos Basin, China: Journal of Petroleum Science Engineering, v. 145, p. 54–65, doi:10.1016/j.petrol.2016.03.009.
Lander, R. H., and L. M. Bonnell, 2010, A model for fibrous illite nucleation and growth in sandstones: AAPG Bulletin, v. 94, no. 8, p. 1161–1187, doi:10.1306/04211009121.
Li, A. F., X. X. Ren, G. J. Wang, Y. Z. Wang, and K. L. Jiang, 2015, Characterization of pore structure of low permeability reservoirs using a nuclear magnetic resonance method: Journal of China University of Petroleum (Edition of Natural Science), v. 39, no. 6, p. 92–98, doi:10.3969/j.issn.1673-5005.2015.06.012.
Lin, Y. B., J. Zhang, X. G. Liu, and H. T. Zhou, 2008, Pore structure features of reservoirs at late high water-cut stage, Lamadian oilfield, Daqing, China: Petroleum Exploration and Development, v. 35, no. 2, p. 215–219, doi:10.1016/S1876-3804(08)60029-4.
Liu, G., S. Li, D. Gu, Y. Lu, and E. Asamoah, 2016, Experimental study of petrophysical properties of a tight formation by considering the clay minerals and flow sensitivities: Earth Sciences Research Journal, v. 20, no. 2, p. B1–B6, doi:10.15446/esrj.v20n2.54508.
Liu, G., F. Xu, C. Xu, C. Xie, Y. Wang, M. Niu, and R. Su, 2009, X-ray diffraction study of clay minerals in well Ancan 1 of Hefei Basin and analysis of the diagenesis degree: Hefei Gongye Daxue Xuebao. Ziran Kexueban (Natural Science Edition), v. 32, no. 12, p. 1911–1915.
Liu, F., X. M. Zhu, Y. Li, L. M. Xu, X. B. Niu, S. F. Zhu, X. W. Liang, M. G. Xue, and J. C. He, 2015, Sedimentary characteristics and facies model of gravity flow deposits of Late Triassic Yanchang formation in southwestern Ordos Basin, NW China: Petroleum Exploration and Development, v. 42, no. 5, p. 633–645, doi:10.1016/S1876-3804(15)30058-6.
Loucks, R. G., R. M. Reed, S. C. Ruppel, and U. Hammes, 2012, Spectrum of pore types and networks in mudrocks and a descriptive classification for matrix-related mudrock pores: AAPG Bulletin, v. 96, no. 6, p. 1071–1098, doi:10.1306/08171111061.
Manrique, E., V. E. Muci, and M. E. Gurfinkel, 2007, EOR field experiences in carbonate reservoirs in the United States: SPE Reservoir Evaluation & Engineering, v. 10, no. 6, p. 667–686, doi:10.2118/100063-PA.
Mo, S. Y., S. L. He, G. Lei, S. H. Gai, and Z. K. Liu, 2015, Effect of the drawdown pressure on the relative permeability in tight gas: A theoretical and experimental study: Journal of Natural Gas Science and Engineering, v. 24, p. 264–271, doi:10.1016/j.jngse.2015.03.034.
Morad, S., K. Al-Ramadan, J. M. Ketzer, and L. F. D. Ros, 2010, The impact of diagenesis on the heterogeneity of sandstone reservoirs: A review of the role of depositional facies and sequence stratigraphy: AAPG Bulletin, v. 94, no. 8, p. 1267–1309, doi:10.1306/04211009178.
Nguyen, B. T. T., S. J. Jones, N. R. Goulty, A. J. Middleton, N. Grant, A. Ferguson, and L. Bowen, 2013, The role of fluid pressure and diagenetic cements for porosity preservation in Triassic fluvial reservoirs of the Central Graben, North Sea: AAPG Bulletin, v. 97, no. 8, p. 1273–1302, doi:10.1306/01151311163.
Nieves, E. T. J., R. J. C. Bravo, L. E. A. Arhuata, and D. Magnelli, 2016, Hybrid model application to predict permeability in tight gas reservoirs: SPE Argentina Exploration and Production of Unconventional Resources Symposium, Buenos Aires, Argentina, June 1–3, 2016, SPE-180972-MS, 20 p., doi:10.2118/180972-MS.
Ozkan, A., S. P. Cumella, K. L. Milliken, and S. E. Laubach, 2011, Prediction of lithofacies and reservoir quality using well logs, Late Cretaceous Williams Fork Formation, Mamm Creek field, Piceance Basin, Colorado: AAPG Bulletin, v. 95, no. 10, p. 1699–1723, doi:10.1306/01191109143.
Padhy, G. S., C. Lemaire, E. S. Amirtharaj, and M. A. Ioannidis, 2007, Pore size distribution in multiscale porous media as revealed by DDIF–NMR, mercury porosimetry and statistical image analysis: Colloids and Surfaces A: Physicochemical and Engineering Aspects, v. 300, no. 1–2, p. 222–234, doi:10.1016/j.colsurfa.2006.12.039.
Pu, W., B. Wei, F. Jin, Y. Li, H. Jia, P. Liu, and Z. Tang, 2016, Experimental investigation of CO2 huff-n-puff process for enhancing oil recovery in tight reservoirs: Chemical Engineering Research & Design, v. 111, p. 269–276, doi:10.1016/j.cherd.2016.05.012.
Ran, X., W. U. Shenghe, F. U. Jing, X. Wei, and M. Chu, 2013, Research on the pore structure classification of low permeability reservoir of the Yanchang Formation in Longdong Area, Ordos Basin: Earth Science Frontiers, v. 20, no. 2, p. 77–85.
Rezaee, R., A. Saeedi, and B. Clennell, 2012, Tight gas sands permeability estimation from mercury injection capillary pressure and nuclear magnetic resonance data: Journal of Petroleum Science Engineering, v. 88–89, p. 92–99, doi:10.1016/j.petrol.2011.12.014.
Shanley, K. W., and R. M. Cluff, 2015, The evolution of pore-scale fluid-saturation in low-permeability sandstone reservoirs: AAPG Bulletin, v. 99, no. 10, p. 1957–1990, doi:10.1306/03041411168.
Song, C., and D. Yang, 2017, Experimental and numerical evaluation of CO2 huff-n-puff processes in Bakken formation: Fuel, v. 190, p. 145–162, doi:10.1016/j.fuel.2016.11.041.
Stroker, T. M., N. B. Harris, W. C. Elliott, and J. M. Wampler, 2013, Diagenesis of a tight gas sand reservoir: Upper Cretaceous Mesaverde Group, Piceance Basin, Colorado: Marine and Petroleum Geology, v. 40, p. 48–68, doi:10.1016/j.marpetgeo.2012.08.003.
Tiab, D., and E. C. Donaldson, 2004, Petrophysics: Theory and practice of measuring reservoir rock and fluid transport properties: Burlington, Massachusetts, Gulf Professional Publishing, 889 p.
Tian, X., L. Cheng, R. Cao, Y. Wang, W. Zhao, Y. Yan, H. Liu, W. Mao, M. Zhang, and Q. Guo, 2015, A new approach to calculate permeability stress sensitivity in tight sandstone oil reservoirs considering micro-pore-throat structure: Journal of Petroleum Science Engineering, v. 133, p. 576–588, doi:10.1016/j.petrol.2015.05.026.
Wang, R., P. Shen, Z. Song, and H. Yang, 2009, Characteristics of micro-pore throat in ultra-low permeability sandstone reservoir: Acta Petrolei Sinica, v. 30, no. 4, p. 560–563, doi:10.7623/syxb200904014.
Wang, M., S. A. Zhang, F. Zhang, Y. Liu, H. Guan, J. Li, L. Shao, S. Yang, and Y. She, 2015, Quantitative research on tight oil microscopic state of Chang 7 Member of Triassic Yanchang Formation in Ordos Basin, NW China: Petroleum Exploration and Development, v. 42, no. 6, p. 827–832, doi:10.1016/S1876-3804(15)30079-3.
Wardlaw, N. C., and R. P. Taylor, 1976, Mercury capillary pressure curves and the interpretation of pore structure and capillary behaviour in reservoir rocks: Bulletin of Canadian Petroleum Geology, v. 24, no. 2, p. 225–262.
Wilson, M. D., 1982, Origins of clays controlling permeability in tight gas sands: Journal of Petroleum Technology, v. 34, no. 12, p. 2871–2876, doi:10.2118/9843-PA.
Xi, K., Y. Cao, B. G. Haile, R. Zhu, J. Jahren, K. Bjørlykke, X. Zhang, and H. Hellevang, 2016, How does the pore-throat size control the reservoir quality and oiliness of tight sandstones? The case of the Lower Cretaceous Quantou Formation in the southern Songliao Basin, China: Marine and Petroleum Geology, v. 76, p. 1–15, doi:10.1016/j.marpetgeo.2016.05.001.
Xie, W., W. Yang, G. Yang, Y. Yang, Z. Xie, H. Jin, Q. Zhu, and J. Shen, 2010, Pore structure features of sandstone reservoirs in the Upper Triassic Xujiahe formation in the central part of Sichuan Basin: Natural Gas Geoscience, v. 21, no. 3, p. 435–440.
Xu, B., and S. Ding, 2009, Research status of illite-smectite mixed-layer mineral and its prospect: Journal of Hebei University of Engineering (Natural Science Edition), v. 26, no. 4, p. 56–60.
Xu, S., and H. Li, 2003, Evolvement of reservoir pore-throat-net and remaining oil distribution: Acta Petrolei Sinica, v. 24, no. 4, p. 48–53, doi:10.7623/syxb200304011.
Yang, S., 2013, Study on mechanism and development plan optimization of hot water flooding in tight oil reservoir, M.Sc. thesis, China University of Petroleum (East China), Dongying, Shandong, China, 71 p.
Yang, F., Z. Ning, C. Hu, B. Wang, K. Peng, and H. Liu, 2013, Characterization of microscopic pore structures in shale reservoirs: Acta Petrolei Sinica, v. 34, no. 2, p. 301–311, doi:10.7623/syxb201302012.
Yang, H., X. Niu, L. Xu, S. Feng, Y. You, X. Liang, F. Wang, and D. Zhang, 2016, Exploration potential of shale oil in Chang7 Member, Upper Triassic Yanchang Formation, Ordos Basin, NW China: Petroleum Exploration and Development, v. 43, no. 4, p. 560–569, doi:10.1016/S1876-3804(16)30066-0.
Yang, D., C. Song, J. Zhang, G. Zhang, Y. Ji, and J. Gao, 2015, Performance evaluation of injectivity for water-alternating-CO2 processes in tight oil formations: Fuel, v. 139, p. 292–300, doi:10.1016/j.fuel.2014.08.033.
Yu, W., H. R. Lashgari, K. Wu, and K. Sepehrnoori, 2015, CO2 injection for enhanced oil recovery in Bakken tight oil reservoirs: Fuel, v. 159, p. 354–363, doi:10.1016/j.fuel.2015.06.092.
Yu, F., and H. Su, 2015, Study on imbibition characteristics of water-wet tight sandstones: Contemporary Chemical Industry, v. 44, no. 6, p. 1240–1243, doi:10.3969/j.issn.1671-0460.2015.06.021.
Zhang, L., G. Bai, X. Luo, X. Ma, M. Chen, M. Wu, and W. Yang, 2009, Diagenetic history of tight sandstones and gas entrapment in the Yulin gas field in the central area of the Ordos Basin, China: Marine and Petroleum Geology, v. 26, no. 6, p. 974–989, doi:10.1016/j.marpetgeo.2008.05.003.
Zhang, Y., Z. Fan, D. Yang, H. Li, and S. Patil, 2017, Simultaneous estimation of relative permeability and capillary pressure for PUNQ-S3 model with a damped iterative-ensemble-Kalman-filter technique: SPE Journal, v. 22, no. 3, p. 971–984, doi:10.2118/177846-PA.
Zhang, Y., H. Li, and D. Yang, 2012, Simultaneous estimation of relative permeability and capillary pressure using ensemble-based history matching techniques: Transport in Porous Media, v. 94, no. 1, p. 259–276, doi:10.1007/s11242-012-0003-3.
Zhang, Y., and D. Yang, 2013, Simultaneous estimation of relative permeability and capillary pressure for tight formations using ensemble-based history matching method: Computers & Fluids, v. 71, no. 1, p. 446–460, doi:10.1016/j.compfluid.2012.11.013.
Zhang, Y., and D. Yang, 2014, Estimation of relative permeability and capillary pressure for tight formations by assimilating field production data: Inverse Problems in Science and Engineering, v. 22, no. 7, p. 1150–1175, doi:10.1080/17415977.2013.856899.
Zhang, Y., D. Yang, and C. Song, 2016, A damped iterative EnKF method to estimate relative permeability and capillary pressure for tight formations from displacement experiments: Fuel, v. 167, no. 5, p. 306–315, doi:10.1016/j.fuel.2015.11.040.
Zhao, H., Z. Ning, Q. Wang, R. Zhang, T. Zhao, T. Niu, and Y. Zeng, 2015, Petrophysical characterization of tight oil reservoirs using pressure-controlled porosimetry combined with rate-controlled porosimetry: Fuel, v. 154, p. 233–242, doi:10.1016/j.fuel.2015.03.085.
Zhou, Y., Y. Ji, S. Zhang, and L. Wan, 2016a, Controls on reservoir quality of Lower Cretaceous tight sandstones in the Laiyang Sag, Jiaolai Basin, Eastern China: Integrated sedimentologic, diagenetic and microfracturing data: Marine and Petroleum Geology, v. 76, p. 26–50, doi:10.1016/j.marpetgeo.2016.05.019.
Zhou, X., J. Wang, C. Lan, and J. Dai, 2016b, Forming mechanisms of chlorite films in Yanchang Formation: Ordos Basin: Journal of China University of Petroleum (Edition of Natural Science), v. 40, no. 4, p. 20–28, doi:10.3969/j.issn.1673-5005.2016.04.003.
Zhu, H., L. An, and C. Jiao, 2015, The difference between constant-rate mercury injection and constant-pressure mercury injection and the application in reservoir assessment: Natural Gas Geoscience, v. 26, no. 7, p. 1316–1322, doi:10.11764/j.issn.1672-1926.2015.07.1316.
Zhu, L., Q. Du, Z. Li, H. Yu, and X. Song, 2004, Variation of physical characteristics and wettability of the reservoir at high water-cut stage: Petroleum Exploration and Development, v. 31, no. s1, p. 82–84.
Zhu, L., C. Zhang, W. Shi, Y. Chen, J. Liu, C. Guo, and Y. Cheng, 2016, Study on the method of prediction of irreducible water saturation by combining mercury intrusion and NMR logging data: Kexue Jishu Yu Gongcheng, v. 16, no. 15, p. 22–29.
AUTHORS
Guangfeng Liu received his Ph.D. in oil and gas field development engineering from the China University of Petroleum (Beijing) in 2007. He is now a lecturer at the China University of Petroleum (Beijing). His current research interests mainly include evaluation and development of tight sandstone reservoirs.
Yaoxing Bai is an M.Sc. graduate student at the China University of Petroleum (Beijing). He received his B.Sc. degree in petroleum engineering from the China University of Petroleum (Beijing) in 2014. His research interests mainly include evaluation of tight sandstone reservoirs and enhanced oil recovery.
Daihong Gu received his Ph.D. in oil and gas field development engineering from the China University of Geosciences (Beijing) in 2007. He is now an associate professor at the China University of Petroleum (Beijing). His current research interests include evaluation and development of unconventional resources.
Yang Lu received her Ph.D. in computer technology and resources information engineering from the China University of Petroleum (Beijing) in 2008. She is now a lecturer at the China University of Geosciences (Beijing). Her current research interests mainly include evaluation of tight sandstone reservoirs.
Daoyong Yang received his Ph.D. in petroleum systems engineering from the University of Regina in 2005. He is now a professor at the University of Regina. His current research interests mainly include reservoir description and dynamics, phase behavior, mass and heat transfer, unconventional resources exploitation, assisted history matching, well testing, and production optimization.
ACKNOWLEDGMENTS
The authors acknowledge financial support from the National Natural Science Foundation of China (grant number 51404282), the China Scholarship Council (numbers 201506445025 and 201506405022), the PetroChina Innovation Foundation (grant number 2014D-5006-0215), and the Science Foundation of the China University of Petroleum (Beijing) (grant number 2462015YQ0217). The authors acknowledge a Discovery Development Grant and a Discovery Grant awarded to Daoyong Yang from the Natural Sciences and Engineering Research Council of Canada.