The AAPG/Datapages Combined Publications Database
AAPG Bulletin
Figure
AAPG Bulletin; Year: 2018; Issue: September DOI: 10.1306/0108181613217061
Return to Full Text
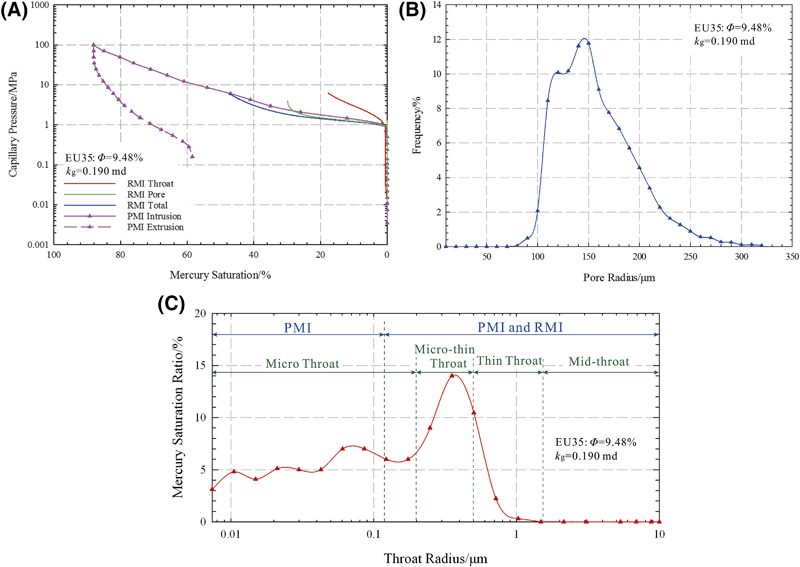
Figure 13. Capillary-pressure curves and pore-throat size distribution by the combination of pressure-controlled mercury injection (PMI) and rate-controlled mercury injection (RMI). (A) Capillary-pressure curves by the comparison of PMI and RMI. (B) Pore size distribution by RMI. (C) Throat grading and overall throat size distribution by combination of PMI and RMI. kg = nitrogen permeability; φ = porosity.
Figure 13. Capillary-pressure curves and pore-throat size distribution by the combination of pressure-controlled mercury injection (PMI) and rate-controlled mercury injection (RMI). (A) Capillary-pressure curves by the comparison of PMI and RMI. (B) Pore size distribution by RMI. (C) Throat grading and overall throat size distribution by combination of PMI and RMI. kg = nitrogen permeability; φ = porosity.