The AAPG/Datapages Combined Publications Database
AAPG Bulletin
Figure
AAPG Bulletin; Year: 2018; Issue: September DOI: 10.1306/0108181613217061
Return to Full Text
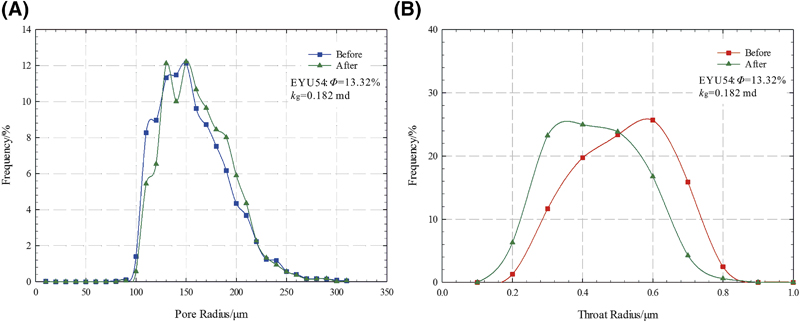
Figure 15. Pore size and throat size distributions before and after brine-flow tests. (A) Pore size distribution curves. (B) Throat size distribution curves. kg = nitrogen permeability; φ = porosity.
Figure 15. Pore size and throat size distributions before and after brine-flow tests. (A) Pore size distribution curves. (B) Throat size distribution curves. kg = nitrogen permeability; φ = porosity.