The AAPG/Datapages Combined Publications Database
AAPG Bulletin
Figure
AAPG Bulletin; Year: 2022; Issue: April DOI: 10.1306/EG.01072120005
Return to Full Text
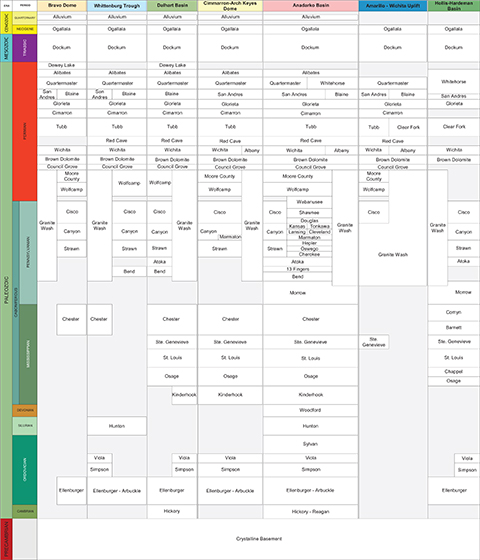
Figure 3.
Generalized stratigraphic correlation chart of the geological formations in the Texas panhandle within each structural region. Distinction from Precambrian uplift structures and deep sedimentary basins corresponds to colors in Figure 2A.
Figure 3. Generalized stratigraphic correlation chart of the geological formations in the Texas panhandle within each structural region. Distinction from Precambrian uplift structures and deep sedimentary basins corresponds to colors in Figure 2A.