The AAPG/Datapages Combined Publications Database
AAPG Bulletin
Figure
AAPG Bulletin; Year: 2022; Issue: April DOI: 10.1306/EG.01072120005
Return to Full Text
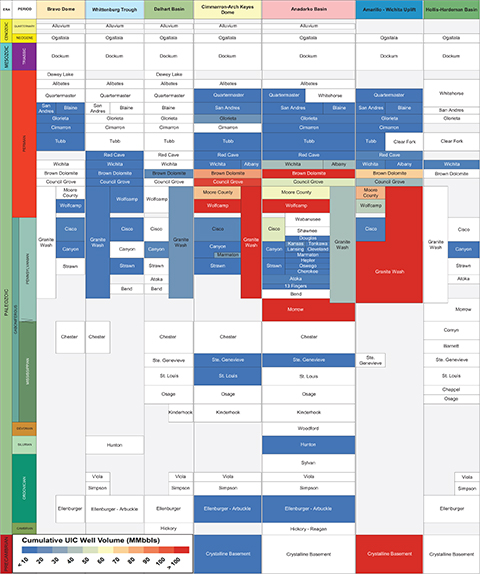
Figure 6.
Heat-mapped stratigraphic correlation chart with disposal targets within each structural subregion. Subregion color in the top row corresponds to map color in Figure 2A. Formation colors indicate injection volume in million barrels (MMbbls) between 1983 and 2018; white indicates no injection into formation. UIC = underground injection control.
Figure 6. Heat-mapped stratigraphic correlation chart with disposal targets within each structural subregion. Subregion color in the top row corresponds to map color in Figure 2A. Formation colors indicate injection volume in million barrels (MMbbls) between 1983 and 2018; white indicates no injection into formation. UIC = underground injection control.