The AAPG/Datapages Combined Publications Database
AAPG Bulletin
Figure
AAPG Bulletin; Year: 2022; Issue: April DOI: 10.1306/EG.01072120005
Return to Full Text
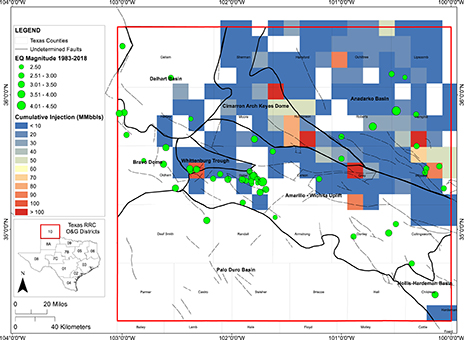
Figure 7.
Geographic distribution of cumulative wastewater injection volumes in 259 km2 (100 mi2) block grids, following the same color scale as Figure 6, between 1983 and 2018. Green circles represent earthquakes (EQ) with magnitude ≥ 2.5 that occurred during this time period; symbol size is relative to magnitude. Dashed lines depict basement-rooted faults with undetermined geometry taken from Ewing (1990). MMbbls = million barrels; O&G = oil and gas; RRC = Railroad Commission of Texas.
Figure 7. Geographic distribution of cumulative wastewater injection volumes in 259 km2 (100 mi2) block grids, following the same color scale as Figure 6, between 1983 and 2018. Green circles represent earthquakes (EQ) with magnitude ≥ 2.5 that occurred during this time period; symbol size is relative to magnitude. Dashed lines depict basement-rooted faults with undetermined geometry taken from Ewing (1990). MMbbls = million barrels; O&G = oil and gas; RRC = Railroad Commission of Texas.