The AAPG/Datapages Combined Publications Database
AAPG Bulletin
Figure
AAPG Bulletin; Year: 2022; Issue: April DOI: 10.1306/EG.01072120005
Return to Full Text
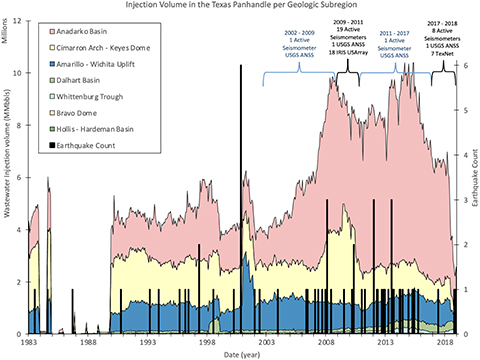
Figure 8.
Injection volume subdivided by structural subregions from 1983–2018. Subregion color corresponds to map color in Figure 2A. Volumes into Bravo dome and Hollis–Hardeman Basin are too low to appear in the graph. The black stacked bars represent the earthquake count (secondary axis) for each month for earthquakes with magnitude (M) ≥ 2.5. Maximum seismometer coverage (19 stations total) occurred from 2009–2011 where a total of six earthquakes M ≥ 2.5 (out of the 64 total) occurred in the study area. ANSS = Advanced National Seismic System; IRIS = Incorporated Research Institutions for Seismology; MMbbls = million barrels; USGS = US Geological Survey.
Figure 8. Injection volume subdivided by structural subregions from 1983–2018. Subregion color corresponds to map color in Figure 2A. Volumes into Bravo dome and Hollis–Hardeman Basin are too low to appear in the graph. The black stacked bars represent the earthquake count (secondary axis) for each month for earthquakes with magnitude (M) ≥ 2.5. Maximum seismometer coverage (19 stations total) occurred from 2009–2011 where a total of six earthquakes M ≥ 2.5 (out of the 64 total) occurred in the study area. ANSS = Advanced National Seismic System; IRIS = Incorporated Research Institutions for Seismology; MMbbls = million barrels; USGS = US Geological Survey.