The AAPG/Datapages Combined Publications Database
AAPG Bulletin
Figure
AAPG Bulletin; Year: 2023; Issue: May DOI: 10.1306/09232222051
Return to Full Text
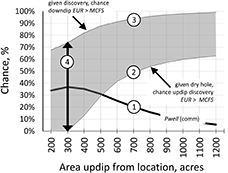
Figure 10.
The solid curve (1) represents the chance the potential well location will be a commercial discovery (Pwell (comm)). The shaded envelope has a lower bound (2) that represents for each location the chance, given a dry hole at that location, that there will be an updip commercial discovery. The upper bound (3) represents for each location, given a discovery there, the percent of the downdip estimated ultimate recovery (EUR) outcomes that exceed the minimum commercial field size (MCFS). Figure 8 shows those boundary values from the 400-ac location to be 13% and 82%, respectively. From a probability perspective, the larger the width of the shaded chance envelope, which reaches a maximum at 300 ac (4), the less ambiguous the well location decision is.
Figure 10. The solid curve (1) represents the chance the potential well location will be a commercial discovery (Pwell (comm)). The shaded envelope has a lower bound (2) that represents for each location the chance, given a dry hole at that location, that there will be an updip commercial discovery. The upper bound (3) represents for each location, given a discovery there, the percent of the downdip estimated ultimate recovery (EUR) outcomes that exceed the minimum commercial field size (MCFS). Figure 8 shows those boundary values from the 400-ac location to be 13% and 82%, respectively. From a probability perspective, the larger the width of the shaded chance envelope, which reaches a maximum at 300 ac (4), the less ambiguous the well location decision is.