The AAPG/Datapages Combined Publications Database
AAPG Bulletin
Figure
AAPG Bulletin; Year: 2023; Issue: May DOI: 10.1306/09232222051
Return to Full Text
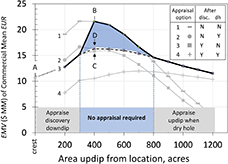
Figure 12.
The expected monetary value (EMV) versus well location area, with the cases indicated by letter (Figure 11A–D). Each of the gray curves represent whether a downdip appraisal is drilled after a discovery (disc.), and whether an updip appraisal is drilled after a dry hole (dh). The shaded polygon represents location areas with enhancement of EMV by saving appraisal costs. EUR = estimated ultimate recovery; $MM = million dollars.
Figure 12. The expected monetary value (EMV) versus well location area, with the cases indicated by letter (Figure 11A–D). Each of the gray curves represent whether a downdip appraisal is drilled after a discovery (disc.), and whether an updip appraisal is drilled after a dry hole (dh). The shaded polygon represents location areas with enhancement of EMV by saving appraisal costs. EUR = estimated ultimate recovery; $MM = million dollars.