The AAPG/Datapages Combined Publications Database
AAPG Bulletin
Full Text
![]() Click to view page images in PDF format.
Click to view page images in PDF format.
AAPG Bulletin, V.
DOI: 10.1306/09181818025
Compositional variation in modern estuarine sands: Predicting major controls on sandstone reservoir quality
Joshua Griffiths,1 Richard H. Worden,2 Luke J. Wooldridge,3 James E. P. Utley,4 and Robert A. Duller5
1Department of Earth, Ocean and Ecological Sciences, University of Liverpool, Liverpool, United Kingdom; BP Exploration, Sunbury-on-Thames, Middlesex, United Kingdom; [email protected], [email protected]
2Department of Earth, Ocean and Ecological Sciences, University of Liverpool, Liverpool, United Kingdom; [email protected]
3Department of Earth, Ocean and Ecological Sciences, University of Liverpool, Liverpool, United Kingdom; BP Upstream Technology, Sunbury-on-Thames, Middlesex, United Kingdom; [email protected]
4Department of Earth, Ocean and Ecological Sciences, University of Liverpool, Liverpool, United Kingdom; [email protected]
5Department of Earth, Ocean and Ecological Sciences, University of Liverpool, Liverpool, United Kingdom; [email protected]
ABSTRACT
Primary depositional mineralogy has a major impact on sandstone reservoir quality. The spatial distribution of primary depositional mineralogy in sandstones is poorly understood, and consequently, empirical models typically fail to accurately predict reservoir quality. To address this challenge, we have determined the spatial distribution of detrital minerals (quartz, feldspar, carbonates, and clay minerals) in surface sediment throughout the Ravenglass Estuary, United Kingdom. We have produced, for the first time, high-resolution maps of detrital mineral quantities over an area that is similar to many oil and gas reservoirs. Spatial mineralogy patterns (based on x-ray diffraction data) and statistical analyses revealed that estuarine sediment composition is primarily controlled by provenance (i.e., the character of bedrock and sediment drift in the source area). The distributions of quartz, feldspar, carbonates, and clay minerals are controlled by a combination of the grain size of specific minerals (e.g., rigid vs. brittle grains) and estuarine hydrodynamics. The abundance of quartz, feldspar, carbonates, and clay minerals is predictable as a function of depositional environment and critical grain-size thresholds. This study may be used, by analogy, to better predict the spatial distribution of sandstone composition and thus reservoir quality in ancient and deeply buried estuarine sandstones.
INTRODUCTION
The composition of sandstone is primarily controlled by the geology of the hinterland, all the processes active between the sediment source area and the final site of deposition, with modification potentially also happening during subsequent eo- and mesodiagenesis (Worden et al., 2018). Sandstone composition can be defined in terms of the proportions of quartz, feldspar, and lithics (QFL), the composition of the lithic fraction, the mineralogy of the matrix, and the amount of carbonate inherited from the initial depositional environment (Folk, 1968). Proportions of QFL and the amount of carbonate exert strong controls on reservoir quality (Primmer et al., 1997; Morad et al., 2010). The composition of sandstone may also significantly impact subsurface flow rates and influence wire-line log responses (e.g., sandstone density, natural radioactivity, electrical conductivity, and water saturation) and thus petrophysical properties (e.g., porosity, permeability, and wettability; Rider and Kennedy, 2011).
The porosity and permeability (reservoir quality) of a sandstone is initially controlled by sediment texture (i.e., grain size and sorting; Beard and Weyl, 1973; Scherer, 1987a, b). However, available statistical correlations typically fail to accurately predict reservoir quality, at least partly because the spatial variability of sandstone composition is poorly understood (Ajdukiewicz and Lander, 2010). The aim of this study is to map and analyze the spatial distribution of sediment texture (i.e., grain size and sorting) and composition (i.e., detrital quartz, feldspar, carbonates, and clay minerals) on a scale that is similar to many oil and gas reservoirs to aid reservoir quality prediction. This study is built upon the initial assumption that sandstone diagenetic systems are largely isochemical with respect to silicate minerals, although it is acknowledged that diagenetic processes that influence carbonate minerals may be somewhat more open system (Worden and Burley, 2003). The Ravenglass Estuary (Figure 1) was chosen for its accessibility, the varied hinterland geology, and because eogenetic alterations are common in many shallow-marine and tidally influenced sandstone reservoirs (Morad et al., 2010). In addition, this work builds on the distribution of detrital clay coats in the Ravenglass Estuary (Wooldridge et al., 2017a, b, 2018).
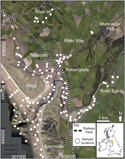 Figure 1. Aerial image (sourced from ArcGIS) of the Ravenglass Estuary, northwest England. Distribution of surface (<2 cm [<0.79 in.]) sediment samples are highlighted by white circles.
The composition of a sandstone is typically described (by petrographers) in terms of the proportions of quartz, feldspar, and lithic grains, hence the use of Folk QFL ternary diagrams (Folk, 1968). Use of QFL diagrams may can help define basin evolution, tectonic regime, and sediment supply over time (Dickinson and Suczek, 1979; Weltje, 2006); sediment transport routes (Caracciolo et al., 2012); and predict reservoir quality (Dutton and Loucks, 2010). Some petrographic studies have recognized that the behavior of lithic grains during compaction strongly varies depending on whether they are either ductile or rigid, with ductile behavior largely a function of the mineralogy of the lithic grain (Worden et al., 1997, 2000). The ductility of lithic grains is largely down to the proportion of clay minerals present; this led Ramm et al. (1997) and Ramm and Bjorlykke (1994) to use a clay mineral index, based on x-ray diffraction (XRD)-defined clay mineral and mica quantities, to predict styles of compaction during sandstone compaction. The quantity of carbonate minerals (primarily eo- and mesogenetic cements) is also vitally important to reservoir quality in many sandstones (Primmer et al., 1997; Morad et al., 1998, 2010). Carbonate minerals are commonly inherited from the specific sedimentary environment in which the sediment was deposited—for example, bioclasts in marine sediments (Worden, 2006) and calcrete and dolocrete in arid, fluvial sediments (Schmid et al., 2006).
Because we have used XRD analysis, as opposed to petrography (which cannot quantify the mineralogy of clay-grade material), in this modern analog study, the QFL end members have here been recast. In this study, Q represents all types of quartz, including mono- and polycrystalline quartz grains and quartz in rigid, granitic and andesitic, lithic grains; F represents all feldspars, including K-feldspar, plagioclase, perthite intergrowths, and any feldspar minerals in granitic and andesitic volcanic lithic grains.
It is harder to define L in terms of XRD data, but here L has been chosen to represent the sum total of all clay minerals, independent of grain size, including illite, chlorite, kaolinite, and smectite. This is in accord with the study by Ramm et al. (1997) that used clay mineral indices (including mica) for ductile compaction studies. The term “clay” refers to all sediment particles that are smaller than 2 μm in size; in contrast, the term “clay mineral” refers to aluminum-rich sheet silicate minerals. The name “illite” in this study is independent of grain size and is used for micalike minerals commonly associated with clastic sediments (e.g., muscovite) following the definition of Grim et al. (1937) (also termed “illitic material” [Moore and Reynolds, 1997]).
A fourth term, C, represents carbonate minerals and has been added since they have a major impact on reservoir quality and are, in many cases, directly attributable to the specific depositional environment; C therefore includes calcite, dolomite, aragonite, and siderite. We therefore propose that XRD studies of sandstone reservoir quality can be described in terms of QFL-C.
Sandstone composition in terms of QFL-C influences rock properties in different ways at different times (e.g., during eodiagenesis and mesodiagenesis [Choquette and Pray, 1970]). Eodiagenesis in sandstones occurs at temperatures less than approximately 60°C or 70°C, at which sediment can be influenced by surface conditions and is in the biologically active zone (Morad et al., 2000; Worden and Morad, 2003). Carbonate cements, concretions, and nodules typically develop in sandstone during eodiagenesis, and feldspar and lithic grain alterations typically start during eodiagenesis (Worden et al., 2018).
Porosity and permeability of sandstones are initially controlled by framework mineralogy (primarily the detrital quartz content), matrix content, mean grain size, and sorting (Scherer, 1987a, b; Ramm and Bjorlykke, 1994). We here discuss how QFL-C may impact sediment transport and deposition (and thus primary depositional mineralogy) and discuss the separate impacts of QFL-C during eodiagenesis and mesodiagenesis on the petrophysical properties (e.g., porosity, permeability, and wettability), composition, strength, and diagenetic reactivity of sandstones. The principles outlined below will be further addressed in the Discussion and Significance: Facilitating Sandstone Reservoir Quality Prediction during Petroleum Exploration, Appraisal, and Field Development and Production sections in relation to the specific results of this study and how they may facilitate reservoir quality prediction.
Sediment composition (QFL-C) may influence host–sediment properties (e.g., matrix content, mean grain size, sorting, and extent of detrital clay coat coverage) and thus impact sediment transport and deposition in the following ways. (1) Intergranular matrix material is typically enriched in clay minerals because of laws of hydrodynamics (Worden and Morad, 2003). (2) The proportion of quartz in sand may influence grain size because quartz grains are relatively resistant to abrasion and are typically coarser than feldspar grains (Odom et al., 1976). (3) Weak framework grains (e.g., feldspar and clay-rich lithics) are likely to be reduced in size and promote wider grain-size distribution (Odom et al., 1976). (4) An abundance of clay minerals, in addition to biosediment interaction (presence of biofilms) in the top few millimeters of the primary depositional environment, may lead to the formation of detrital clay coats (Wooldridge et al., 2017a, b).
Sandstone composition (QFL-C) influences on eodiagenesis include the following. (1) Clay-rich ductile versus rigid grains, in which quartz-rich sediments undergo rigid compaction and phyllosilicate lithic– and mica-rich sediments undergo ductile compaction (Worden et al., 2000). (2) Weak versus strong grains, in which feldspar undergoes grain fracturing under lower tensile stresses than quartz grains (Rawling and Goodwin, 2003; Griffiths et al., 2018). (3) Reactive versus unreactive grains, in which feldspar, phyllosilicate, and carbonate tend to be relatively reactive in contrast to quartz, which is largely unreactive at temperatures less than 70°C to 80°C (Worden et al., 2000; Worden and Burley, 2003).
Sandstone compositional influences on mesodiagenesis are mainly controlled by the mineralogy of primary depositional and eodiagenetic grains, cement, and matrix. One of the major changes to reservoir quality in the mesodiagenetic realm is that exposed monocrystalline quartz surfaces and a suite of clay minerals become reactive at temperatures in excess of 70°C to 80°C (Worden and Burley, 2003; Worden and Morad, 2003). As a result, the following suite of mesodiagenetic processes are typical in sandstones: (1) illite, chlorite, and dickite formation from precursor clay minerals and framework grains; (2) albitization of plagioclase and K-feldspar, which may also lead to small amounts of carbonate and clay mineral cements (Chuhan et al., 2001; Worden and Burley, 2003; Morad et al., 2010); (3) quartz grain pressure solution at grain contacts and subsequent quartz cementation, exacerbated by illite and mica (Oelkers et al., 1996; Meyer et al., 2006) or inhibited by chlorite or mixed-mineralogy chlorite–illite clay coats (Ehrenberg, 1993; Dowey et al., 2012; Saïag et al., 2016; Stricker and Jones, 2018); and (4) dissolution of unstable grains and calcite cements, which may enhance reservoir quality (Morad et al., 2010). In addition, throughout burial diagenesis, mineralogy is a big factor in determining the oil–water wetting preference of sandstones: for example, calcite, weathered feldspars, and Fe-rich chlorite are oil-wet minerals, whereas quartz, illite, and unweathered feldspars are water wet (Barclay and Worden, 2000).
The ability to predict sandstone composition would facilitate prediction of the petrophysical properties of sandstone reservoirs (e.g., porosity, permeability, and wettability) during petroleum exploration, appraisal, and field development and production. This study has focused on the modern Ravenglass Estuary in northwestern England, United Kingdom, by developing a unique modern analog of an estuarine sandstone and has addressed the following specific questions.
1. What minerals are found in the modern Ravenglass Estuary?
2. How are quartz, plagioclase, K-feldspar, carbonate, and clay minerals distributed in this modern estuarine setting?
3. What controls the whole-sediment mineral assemblage in a modern estuarine setting?
4. What controls mineral distribution patterns in estuarine environments?
5. Can the abundance and spatial distribution of sediment composition, and thus reservoir quality, be predicted as a function of grain size, depositional environment, and/or estuarine zone?
STUDY AREA: RAVENGLASS ESTUARY
The Ravenglass Estuary in northwestern England, United Kingdom, was chosen for this modern analog study because it has a similar area to many petroleum fields, was easy to access, is largely unmodified by the built environment, and has varied but well-studied hinterland geology. Furthermore, this study builds upon previous studies focused on detrital clay coat distribution in the Ravenglass Estuary (Wooldridge et al., 2017a, b, 2018).
Estuarine Hydrodynamics and Geomorphology
The Ravenglass Estuary is a shallow, mixed-energy, and macrotidal (>7 m [>23 ft] tidal range) estuarine system that occupies an area of 5.6 km2 (3.5 mi2), of which approximately 86% is intertidal (Bousher, 1999; Lloyd et al., 2013; Wooldridge et al., 2017b). Shallow estuary bathymetry has led to strong tidal asymmetry, resulting in the outward ebb tidal flow being prolonged in comparison with the inward tidal flow (Kelly et al., 1991). The discharge in the lower-Esk arm of the estuary during the ebb tidal flow (4.99 m3 s−1 [16.37 ft3 s−1]) is only slightly lower than flood tidal flow (5.41 m3 s−1 [17.75 ft3 s−1]) because of a short estuarine length (Kelly et al., 1991). Drigg and Eskmeals coastal spits provide shelter from wave action to the inner-estuarine zones and the central basin (Figures 2A, 3); however, strong tidal currents have resulted in extensive tidal bars and tidal dunes landward of the low-energy central minimum. The rivers flowing into the estuary have average flow rates of 0.4 m3 s−1 (1.31 ft3 s−1) for the River Mite, 3.4 m3 s−1 (11.15 ft3 s−1) for the River Irt, and 4.2 m3 s−1 (13.78 ft3 s−1) for the River Esk (Bousher, 1999). Anthropogenic impact on the estuary is here considered to be minor, excluding the sheltering of the inner Mite from tidal currents and increased salt marsh development as a consequence of the railway viaduct construction (Carr and Blackley, 1986).
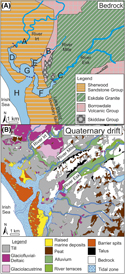 Figure 2. Geological setting of the Ravenglass Estuary, United Kingdom. (A) Bedrock geology (Ordovician Skiddaw Group and Borrowdale Volcanic Group, Devonian Eskdale Intrusions, and Triassic Sherwood Sandstone Group) and division of estuarine zones: lower Irt (A); lower Mite (B); lower Esk (C); inner Irt (D); inner Mite (E); inner Esk (F); central basin (G); and outer estuary (H). (B) Quaternary drift deposits.
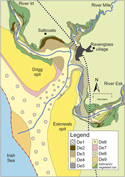 Figure 3. Nature and organization of depositional environments in the Ravenglass Estuary, labeled accordingly: gravel bed (De1); mud flat (De2); mixed flat (De3); sand flat (De4); tidal bars and dunes (De5); tidal inlet (De6); backshore (De7); foreshore (De8); and proebb delta (De9).
Geological Setting
Sandstone compositions are largely controlled by the characteristics of the sediment’s provenance, sedimentary processes active in the depositional basin, and sediment transport pathways that link provenance to basin, which is ultimately controlled by tectonic regime (Dickinson and Suczek, 1979). As a result, to assess the influence that provenance may have imposed on mineral type and distribution patterns in the Ravenglass Estuary, it is first necessary to the identify the potential source of sediment mineral grains in the drainage basin. The type and spatial distribution of bedrock and drift deposits in the drainage basins of the Rivers Irt, Mite, and Esk are presented in Figure 2.
The northern River Irt drains Ordovician Borrowdale Volcanic Group andesites and the Triassic Sherwood Sandstone Group, whereas the River Esk predominantly drains the Devonian Eskdale Intrusions (Figure 2A). The Lower Triassic Sherwood Sandstone Group (locally known as the St Bees Sandstone Member) dominates the low-lying coastal planes and is predominantly composed of fluviatile sandstones (Quirke et al., 2015). The Borrowdale Volcanic Group, in the north of the provenance area, was subjected to subgreenschist facies metamorphism during the Caledonian orogeny (395 Ma) and is comprised of K-rich, calc-alkaline andesite (Quirke et al., 2015). The northern part of the Eskdale Intrusions, dominating to the east and south of the provenance area, is a coarse-grained granite, and the southern part is a granodiorite (Young et al., 1986). The Ordovician Skiddaw Group is comprised of weakly metamorphosed, fine-grained sedimentary rocks (Merritt and Auton, 2000) and is proximal to the Ravenglass Estuary (Figure 2A).
Quaternary drift deposits were deposited in response to spatially variable, glacio-isostatic rebound and glacio-eustatic sea-level change, following the last glaciation (late Devensian, ca. 28 to 13 ka) (Moseley, 1978; McDougall, 2001). However, much of the glacial deposit has since been eroded from the land surface (Merritt and Auton, 2000). The Seascale Glacigenic Formation (wide range of glacial and proglacial outwash sediments) is drained by the Rivers Irt, Esk, and Mite. The Gosforth Glacigenic Formation is primarily restricted to the northern River Irt and Mite drainage basin (Figure 2B). The Ravenglass Estuary is underlain by the Ravenglass Till Member (part of the Seascale Glacigenic Formation), which is locally exposed as knolls throughout the estuary.
SAMPLES AND METHODS
We undertook detailed ground surveys (aided by aerial imagery) and collected estuarine and drift deposit samples for grain-size and mineralogy analysis to assess the relationship between sediment composition, host–sediment properties (e.g., grain size), and depositional environment.
Field Mapping and Sample Collection
Aerial imagery and detailed ground surveys were used to define a suite of estuarine subenvironments. Sand abundance was used to subdivide tidal flats following the classification scheme proposed by Brockamp and Zuther (2004). According to this scheme, a sand flat has >90% sand, a mixed flat has 50%–90% sand, and a mud flat has 15%–50% sand. Surface sediment samples (n = 191) were collected at low tide along predefined transects to give an approximately uniform distribution of estuarine and fluvial samples (Figure 1). Quaternary drift deposits were collected from exposed cliff sections in the inner Esk as well as from the Ravenglass Till Member, locally exposed as knolls throughout the estuary. Sediment samples were placed in airtight plastic jars in the field and stored in a refrigeration unit at approximately 2°C to prevent sample degradation prior to grain-size and mineralogical analyses. Mean grain size (microns), grain-size sorting (σg; geometric method, where higher values reflect more poorly sorted sediment), and sand abundance (percentage) were quantified using a Beckman Coulter laser particle size analyzer and GRADISTAT software (Blott and Pye, 2001). The grain-size sorting scale presented by Folk and Ward (1957) is here used, in which high values are indicative of poorly sorted sediment. Grain-size sorting classes are as follows: 1.27–1.41 (well sorted), 1.41–1.62 (moderately well sorted), 1.62–2.0 (moderately sorted), 2.0–4.0 (poorly sorted), and 4–16 (very poorly sorted).
Clay Mineral Separation, Identification, and Quantification
X-ray Diffraction Analysis
To ensure accurate mineralogy identification and quantification (especially for chlorite, illite, mica, and kaolinite in the clay fraction of the sediment) and to analyze illite chemistry and crystallinity, clay fractions (<2 μm) and silt and sand fractions (2 μm to 2 mm) of estuarine sediment and Quaternary drift samples were physically separated prior to XRD analysis.
Clay fractions (<2 μm) were physically separated (isolated from the silt and sand fractions) in an ultrasonic bath, followed by gravity settling and then centrifuge settling at 5000 rpm for 10 min. The wet-separated clay fractions were then dried at 60°C for 24 hr and weighed to calculate the percentage of clay-size material. Dried clay fractions were crushed using a pestle and mortar prior to back-loading into cavity mounts and XRD analysis.
A representative 5-g subsample was taken from the separated silt and sand fractions (2 μm to 2 mm) and placed in an agate McCrone mill with 12 ml of distilled water and finely crushed for 10 min. The resultant slurry was washed into a petri dish using distilled water and then dried at 60°C. The dried material was crushed into a fine, loose powder using an agate pestle and mortar prior to back-loading into cavity mounts and XRD analysis to quantify the mineralogy of the silt and sand fractions (2 μm to 2 mm).
The mineralogy of the clay fraction (<2 μm) and silt and sand fraction (2 μm to 2 mm) was determined using a PANalytical X’Pert Pro MPD x-ray diffractometer. The XRD analyses were performed on randomly oriented powders, as opposed to oriented mounts, to achieve the precise (repeatable) quantification of all minerals, not just clay minerals. Mineralogy was determined by comparing acquired diffractograms with those in the International Centre for Diffraction Data Powder Diffraction File-2008 and with supplementary information from Moore and Reynolds (1997). The minerals were then quantified using the relative intensity ratio method proposed by Chung, (1974a, b); results from this quantification method have been reported to be highly accurate (Hillier, 2000, 2003). The XRD results of the fine fraction (<2 μm) and silt and sand fraction (2 μm to 2 mm) were then recombined, factoring in the relative weight percentages of each size fraction to quantify the mineralogy of the whole sample (all material <2 mm).
The Esquevin index, which has previously been used to decipher sediment provenance (Gingele et al., 2001; Oliveira et al., 2002; Borchers et al., 2011; Bout-Roumazeilles et al., 2013; Armynot du Châtelet et al., 2016), has been calculated (using clay fraction XRD data) to differentiate Al-rich from Fe–Mg-rich illite. An Esquevin index is calculated by analyzing the ratio between the 5 Å and 10 Å peak heights on x-ray diffractograms (Esquevin, 1969). High Esquevin indices indicate Al-rich illites (typically derived from chemically weathered rocks), whereas low Esquevin index values represent relatively Fe–Mg-rich illite (typically derived from physically eroded, unweathered rocks; Chamley, 1989). The following classification boundaries have been used in this study, after Esquevin (1969): biotite, less than 0.15 (most Fe–Mg rich); biotite + muscovite, 0.15–0.3; phengite, 0.3–0.4; and muscovite, greater than 0.4 (most Fe–Mg depleted).
To establish illite crystallinity index (2°θ), also known as the Kübler index (Kübler, 1964), the full width at half maximum of the 10 Å (001, cubic edge direction using international Miller Index system) illite peak was measured on the x-ray diffractogram (using clay fraction XRD data). Highly crystalline illite is indicated by low illite crystallinity indices (narrow basal reflections), whereas poorly crystalline illite is indicated by high illite crystallinity indices (broad basal reflections) (Chamley, 1989). The following boundaries are used, after Kübler (1964): epizone (highest temperature), less than 0.25; anchizone, 0.25–0.42; and diagenesis (lowest temperature), greater than 0.42.
Mineralogy of different-size fractions separated from a central basin (mixed-flat) sample was determined by XRD using a combination of gravity settling (as above) and sieving. The following grain-size classes were analyzed: less than 0.2 μm (fine clay); 0.2 to 2 μm (coarse clay); 2 to 32 μm (fine silt); 32 to 62 μm (coarse silt); 62 to 125 μm (very fine sand); and 125 to 250 μm (fine sand).
Oil-wet mineral abundance was calculated as the sum total of oil-wet minerals, after Barclay and Worden (2000): calcite, dolomite, kaolinite (assuming early alteration to kaolinite booklets), hematite, feldspar (assuming weathered; unweathered feldspars are water wet), and Fe-rich chlorite abundance. It is important to note that we have here assumed that (1) kaolinite will form kaolinite booklets during diagenesis and (2) feldspars are weathered feldspar based on scanning electron microscopy–energy-dispersive spectrometry (SEM-EDS) results from Daneshvar and Worden (2018) in the Ravenglass Estuary.
Quantitative Evaluation of Minerals by Scanning Electron Microscopy
Polished thin sections were made to provide textural and mineralogical information on detrital grains and clay minerals (chlorite, illite, and kaolinite) to assess to what extent clay minerals occur as lithics and as part of the fine fraction (<2 μm). The SEM-EDS system employed in this study was an FEI WellSite QEMSCAN® (quantitative evaluation of minerals by scanning electron microscopy) system, which is composed of a scanning electron microscope coupled with energy-dispersive spectrometers. The QEMSCAN data provide information about the micron-scale texture and chemical and mineralogical composition. Data were collected with a step size of 2 μm to ensure both the fine fraction (<2 μm) and silt and sand fraction (>2 μm) were analyzed.
Spatial Mapping
Mineral distribution maps were made in ArcGIS® using an inverse distance weighted interpolation technique to avoid the creation of ridges or valleys of extreme and unrepresentative values (Watson and Philip, 1985). An interpolation barrier (polyline drawn in ArcGIS) along the long axis of Drigg and Eskmeals spits was used to ensure interpolated values on either side of the spits (i.e., in the estuary and on the coast) did not influence one another despite their relative spatial proximity.
Statistical Analysis
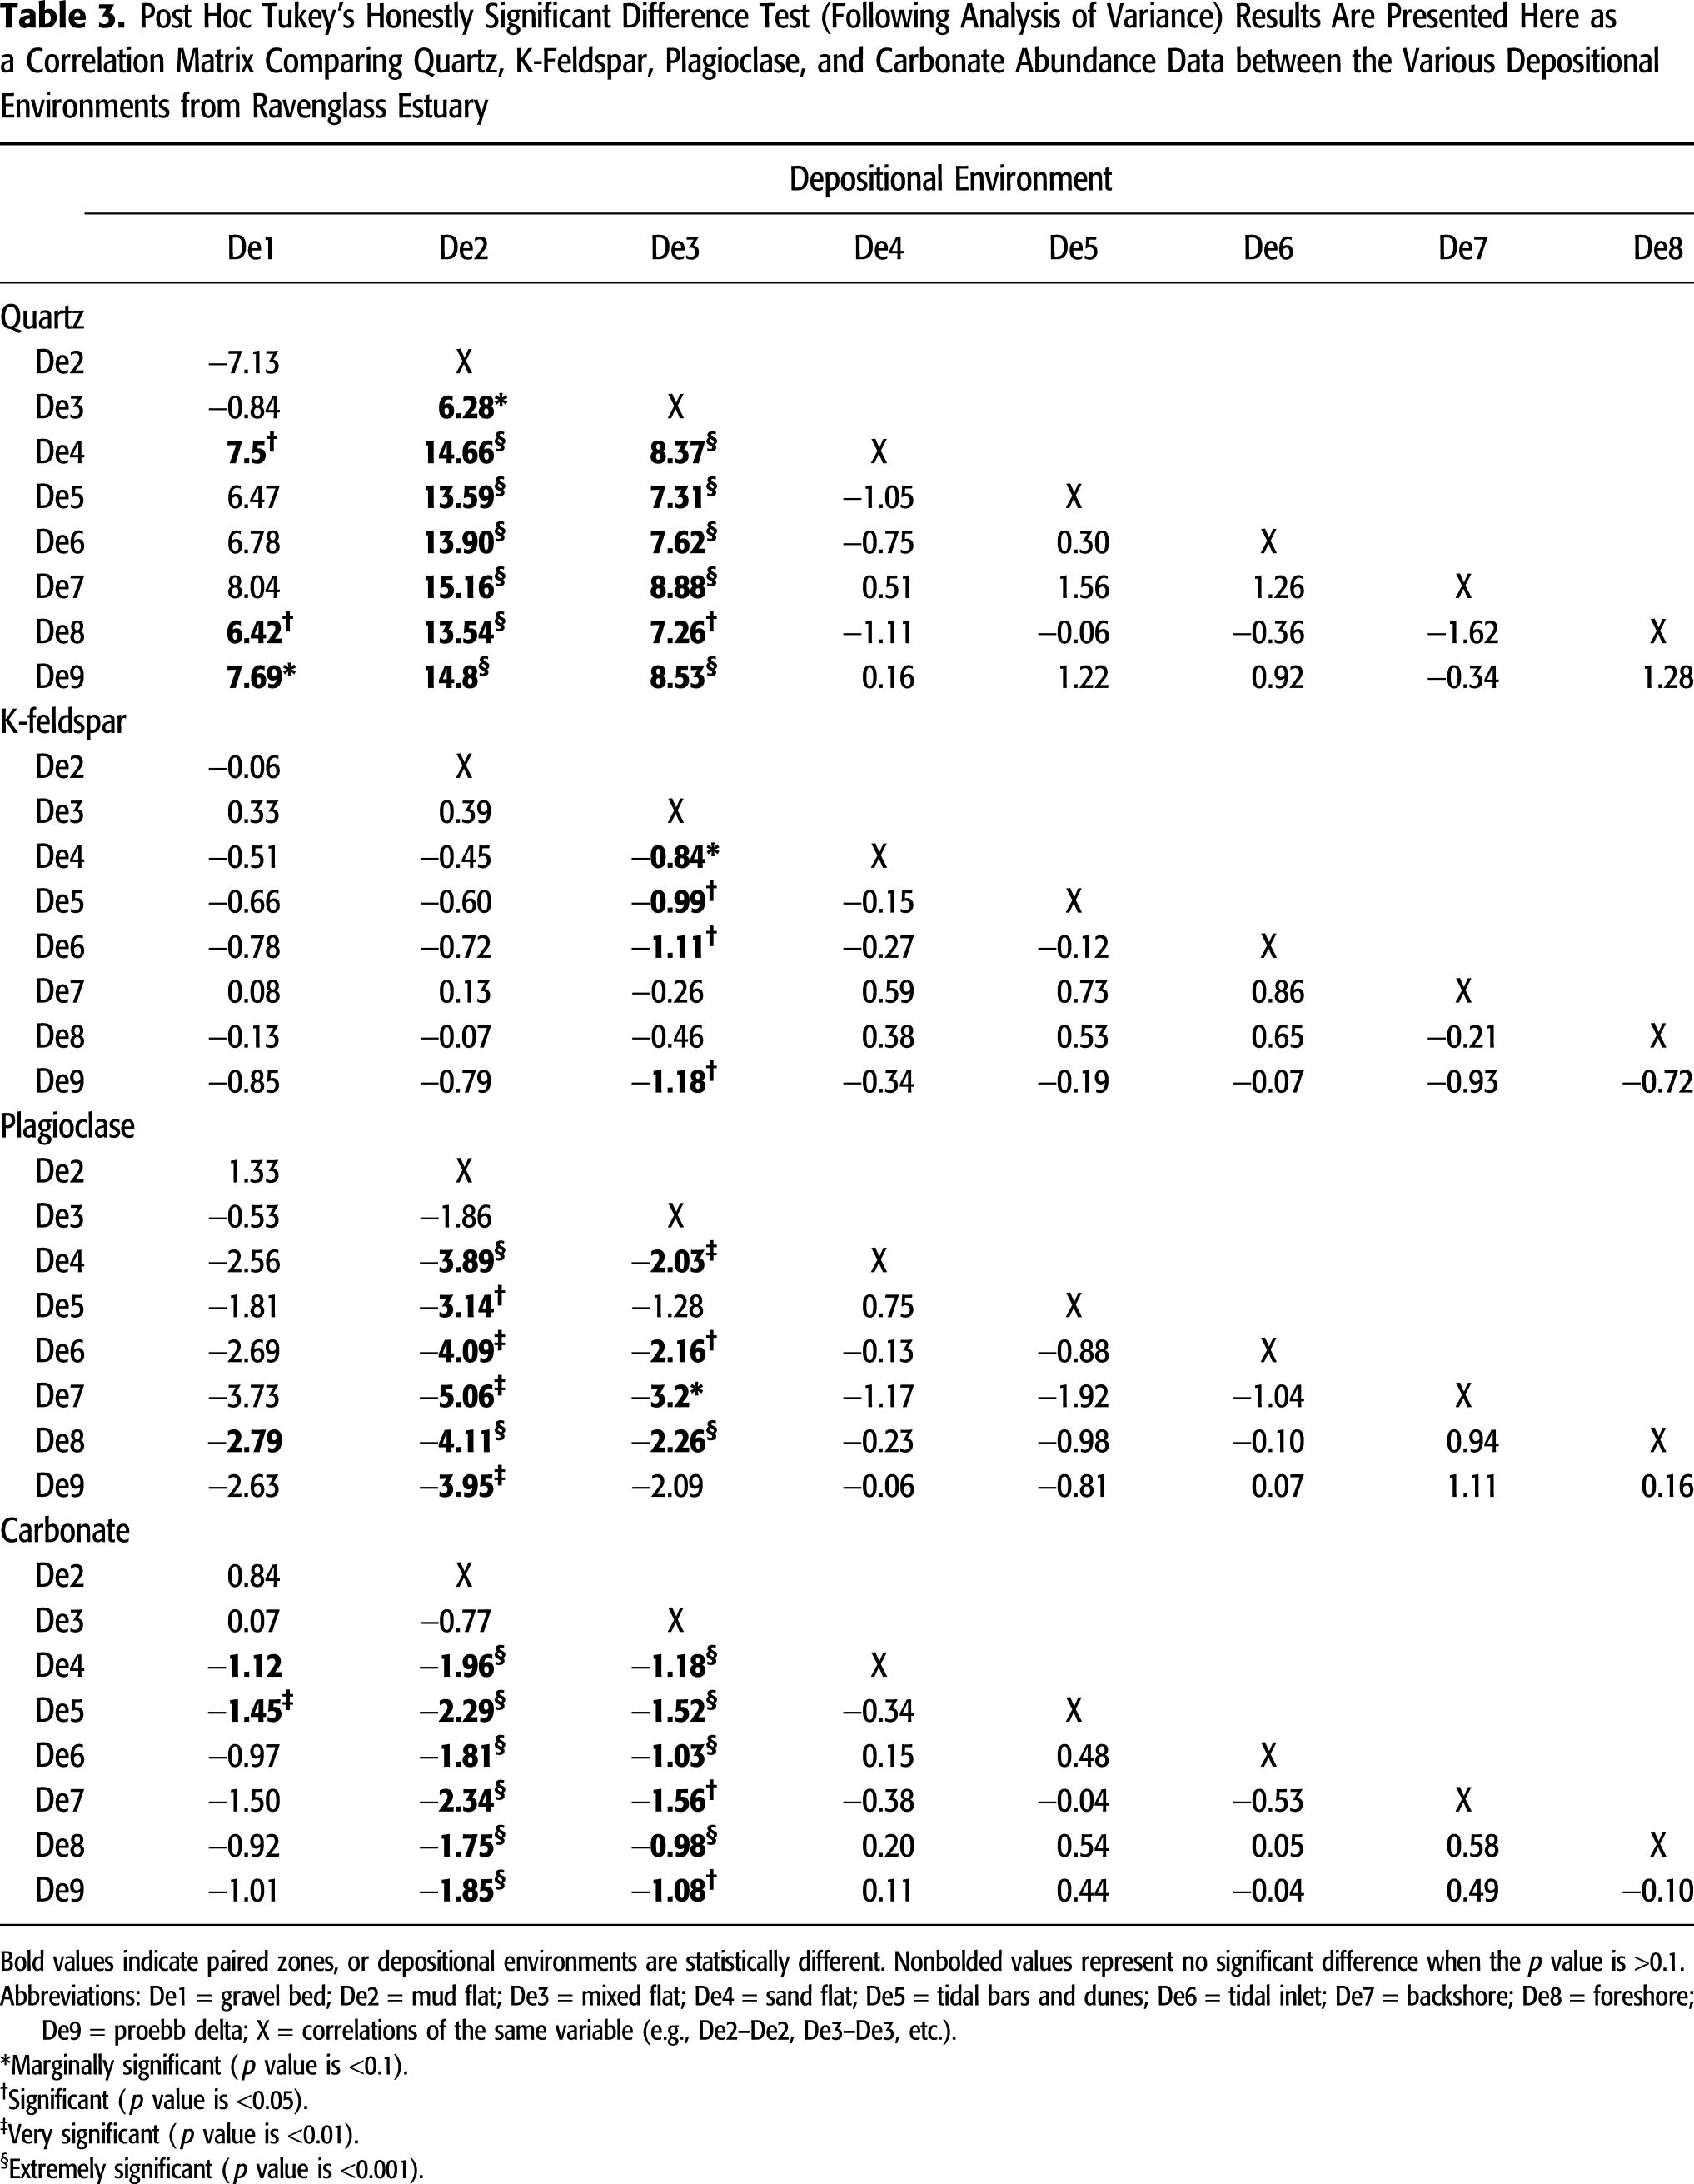
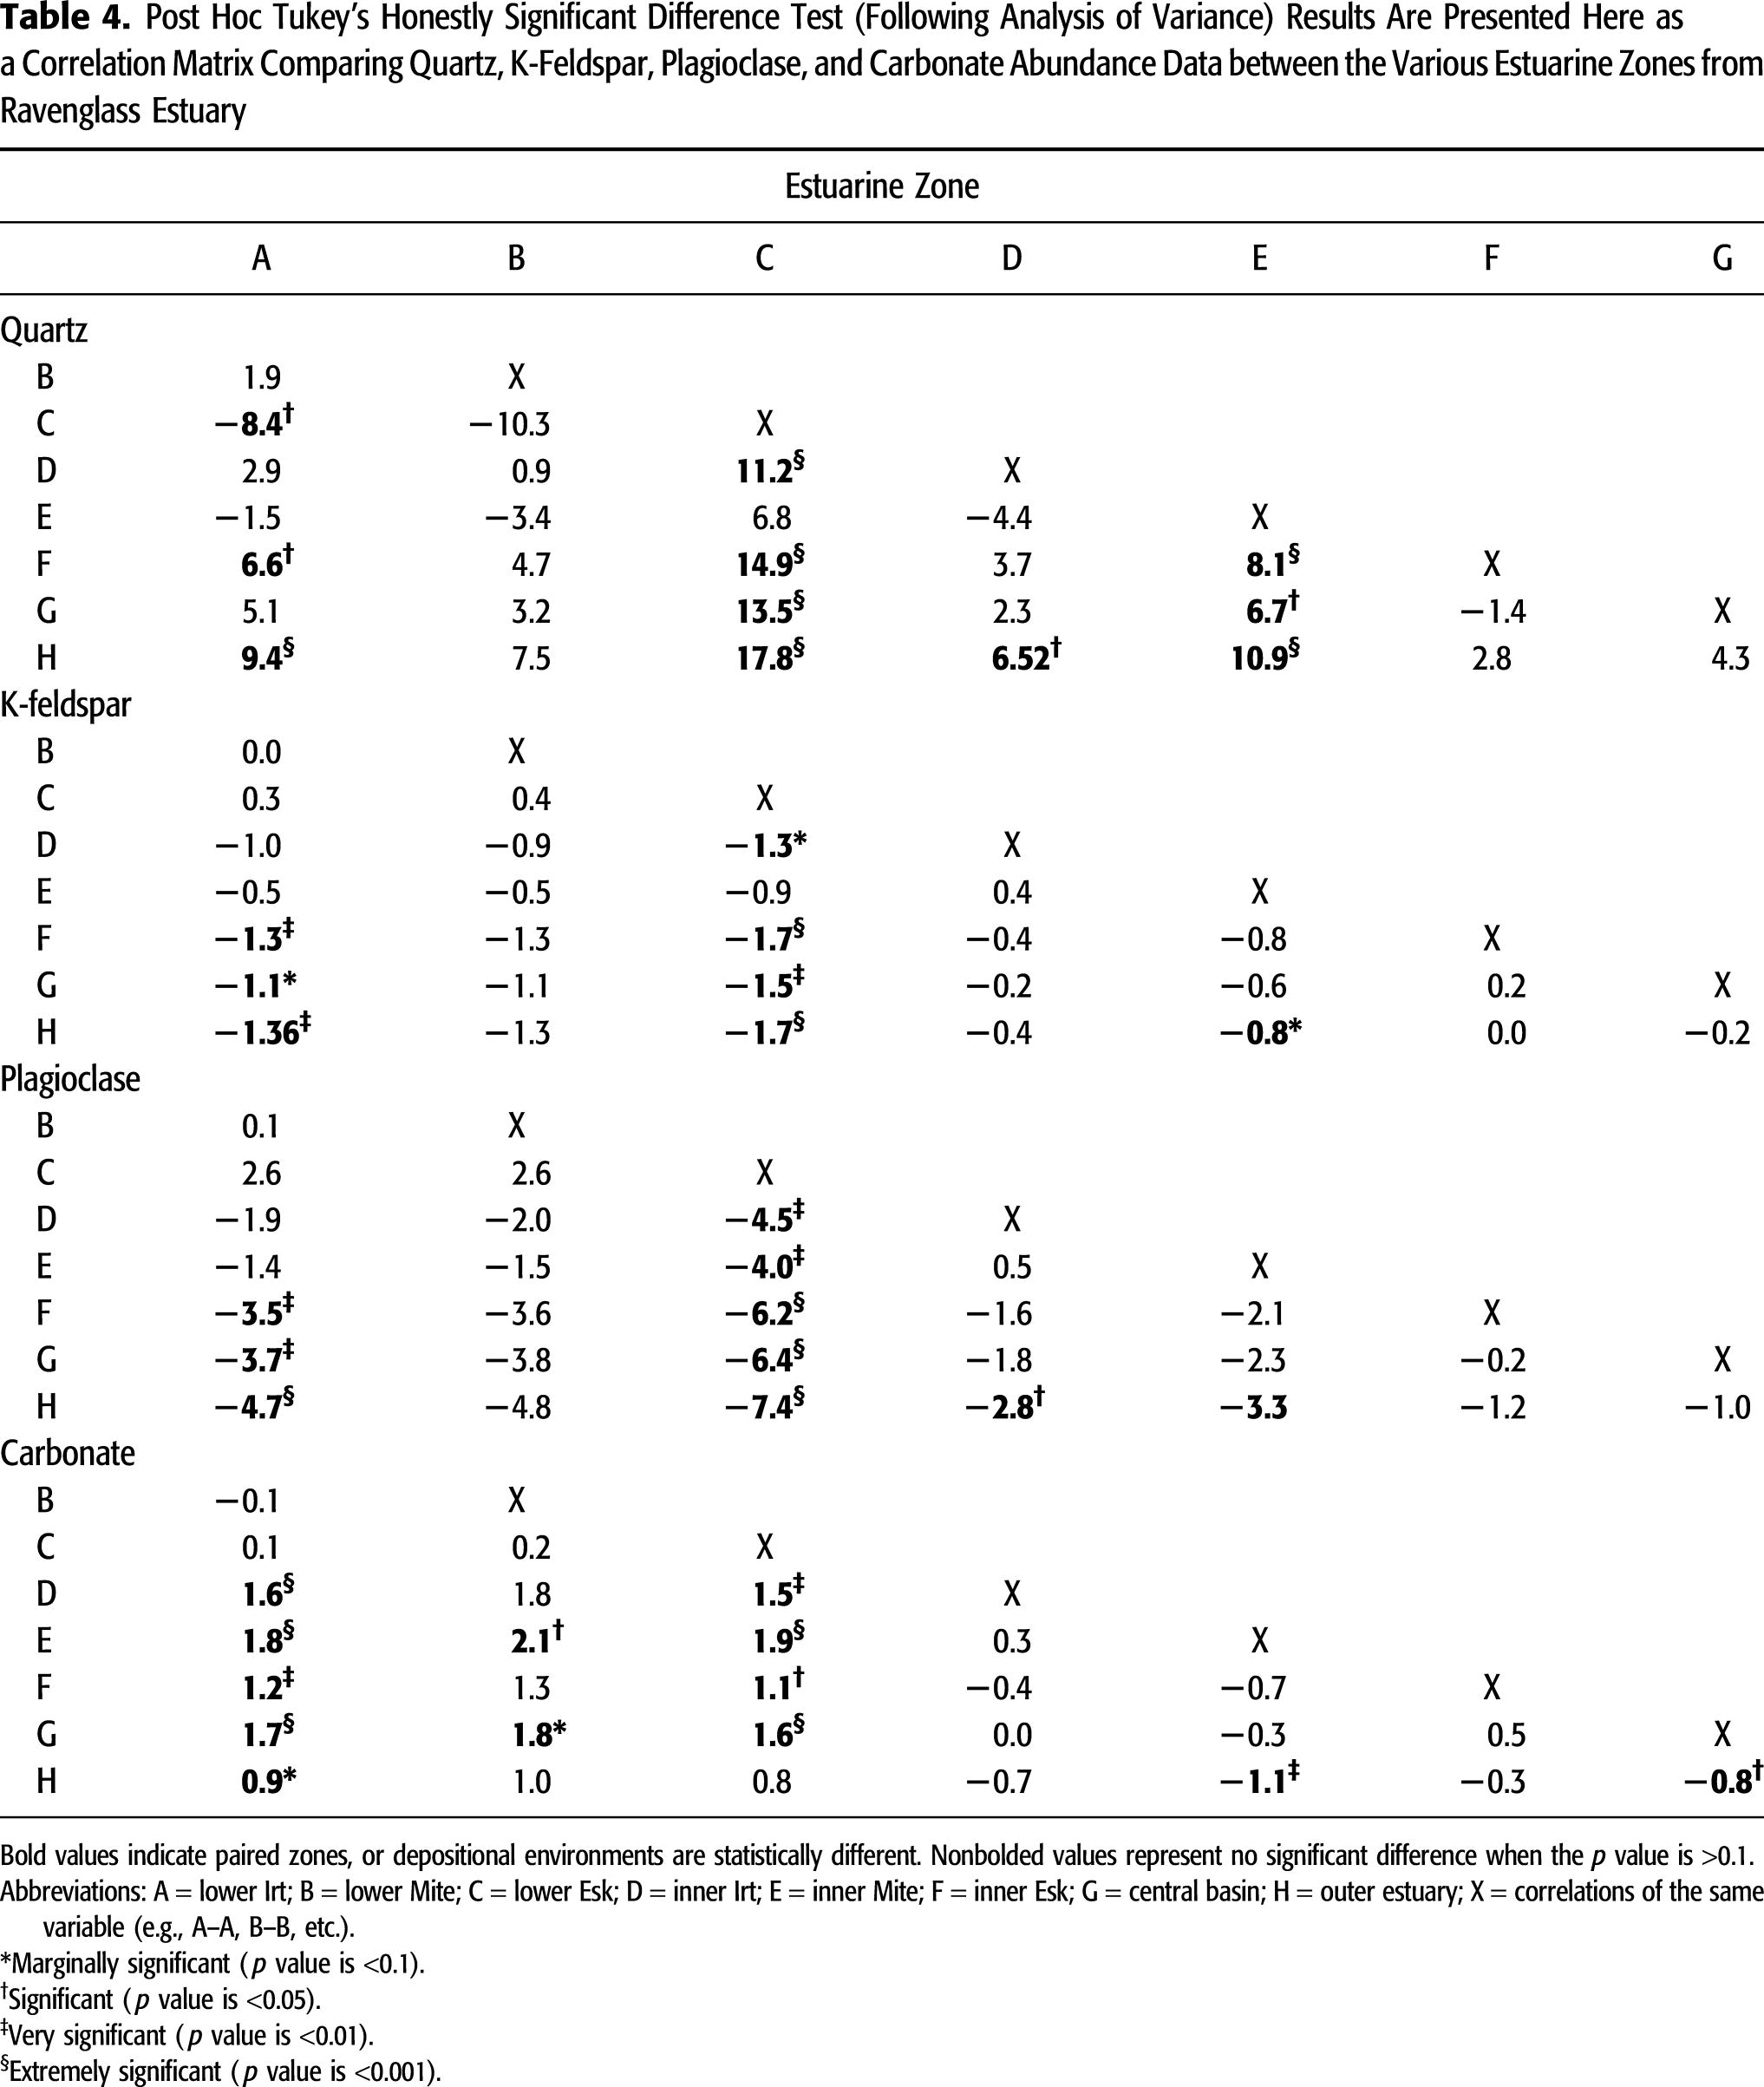
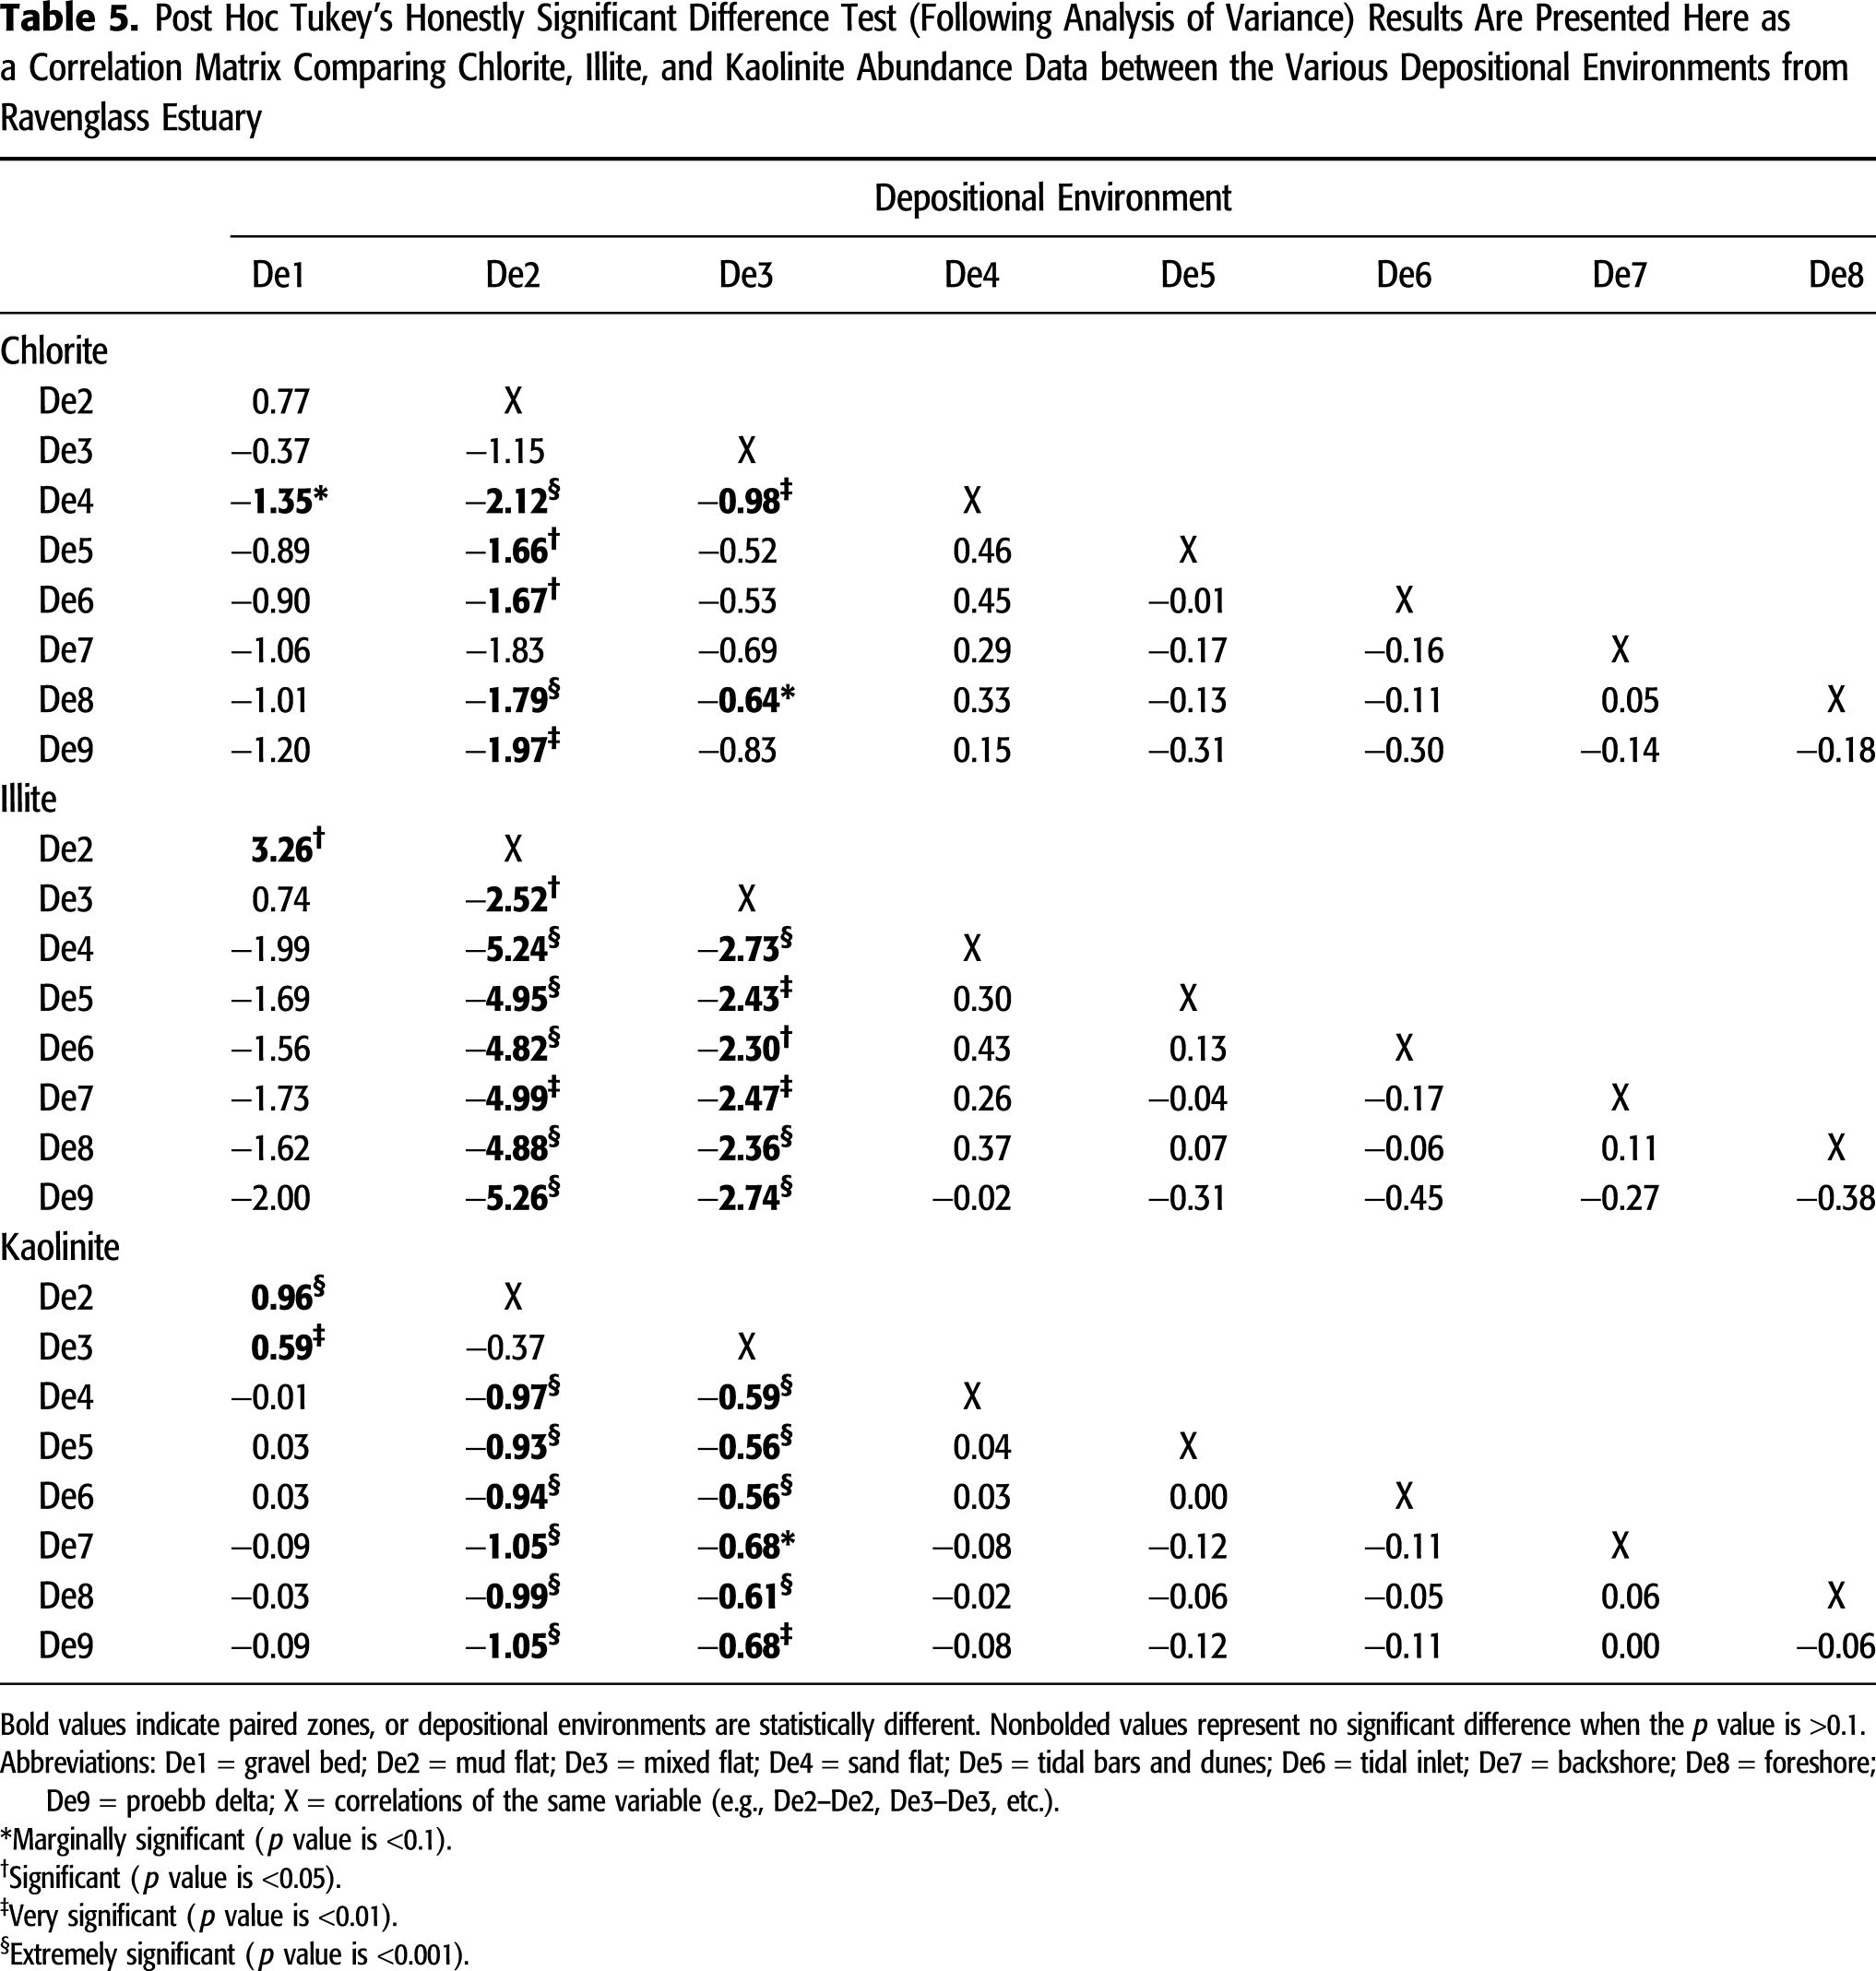
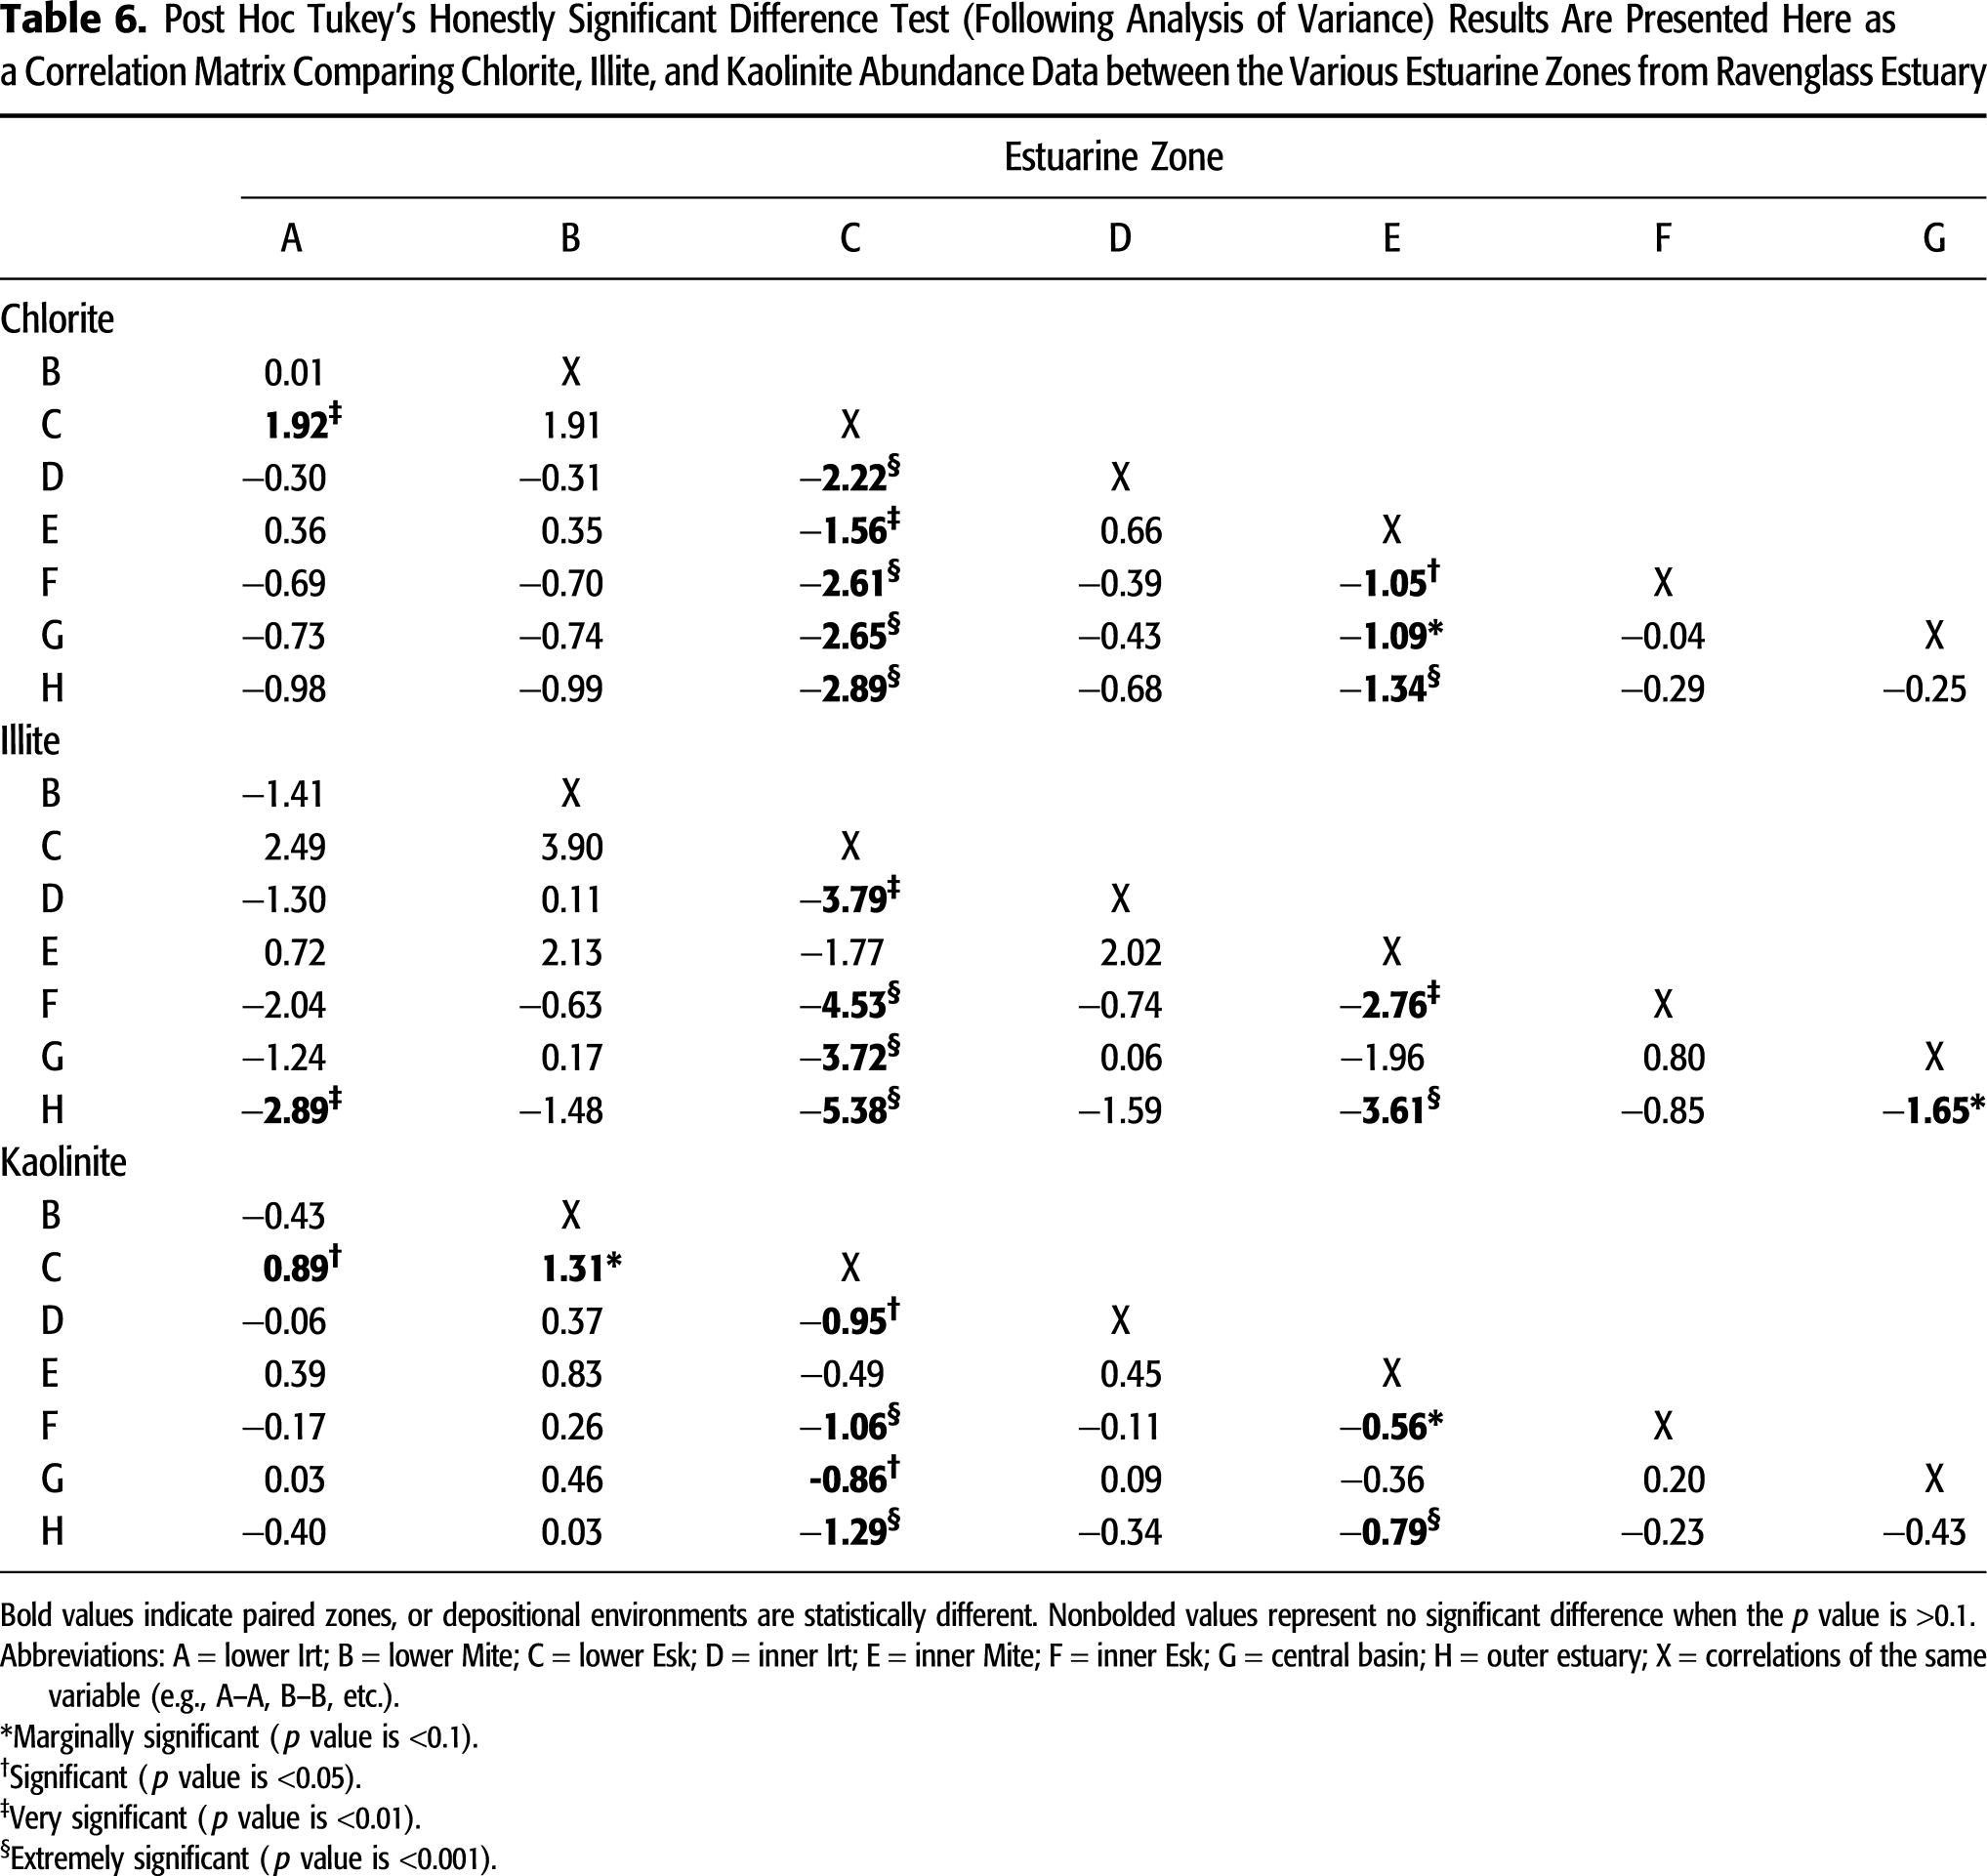
An analysis of variance (ANOVA) test was used to assess whether there is a statistically significant difference in abundance of specific minerals as a function of depositional environment (De1 to De9) and estuarine zone (A–H). Following ANOVA, a post hoc Tukey’s honestly significant difference (HSD) test (Odeh and Evans, 1974; R Core Team, 2016) was employed to determine which individual depositional environment or estuarine zones were statistically different from one another as a function of specific mineral abundance (quartz, feldspar, clay minerals, and carbonate). The following symbols were used to highlight statistical significance (p value); marginally significant (+) when the p value was <0.1; significant (∗) when the p value was <0.05; very significant (∗∗) when the p value was <0.01; and extremely significant (∗∗∗) when the p value was <0.001. All statistical analyses were performed in R statistical software (R Core Team, 2016).
RESULTS
In this section, we present results from detailed ground surveys (aided by aerial imagery) undertaken to identify the nature and distribution of the depositional environment as well as results from laboratory analyses used to quantify sediment properties (grain size, sorting, and mineralogy).
Estuarine Sediment Characteristics
The estuary has been subdivided into discrete fluvial, inner, central, and outer zones (Figure 2A) based upon reported salinity data and the dominant physical processes active in each zone (Assinder et al., 1985; Daneshvar, 2015). Zones A to C represent fluvial (river) regions that are freshwater dominated; zones D to F (inner) represent brackish, inner river– and tide-dominated regions; zone G (central) is a relatively mixed-energy (fluvial-, tide-, and wave-influenced) and heterogeneous central zone with near-seawater salinity that contains extensive mud flat and mixed flat (locally named Saltcoats tidal flat); and zone H (outer) is seawater dominated and subject to strong wave and tidal currents.
The mapped distribution of nine discrete depositional environments are presented and explained in Figure 3.
The average grain size and grain-size sorting of each depositional environment and estuarine zone are presented in Tables 1 and 2. The mapped distributions of grain size and grain sorting are presented Figure 4. Variation in grain size and grain sorting for each estuarine zone and depositional environment are displayed in Figure 5 and Tables 1 and 2.
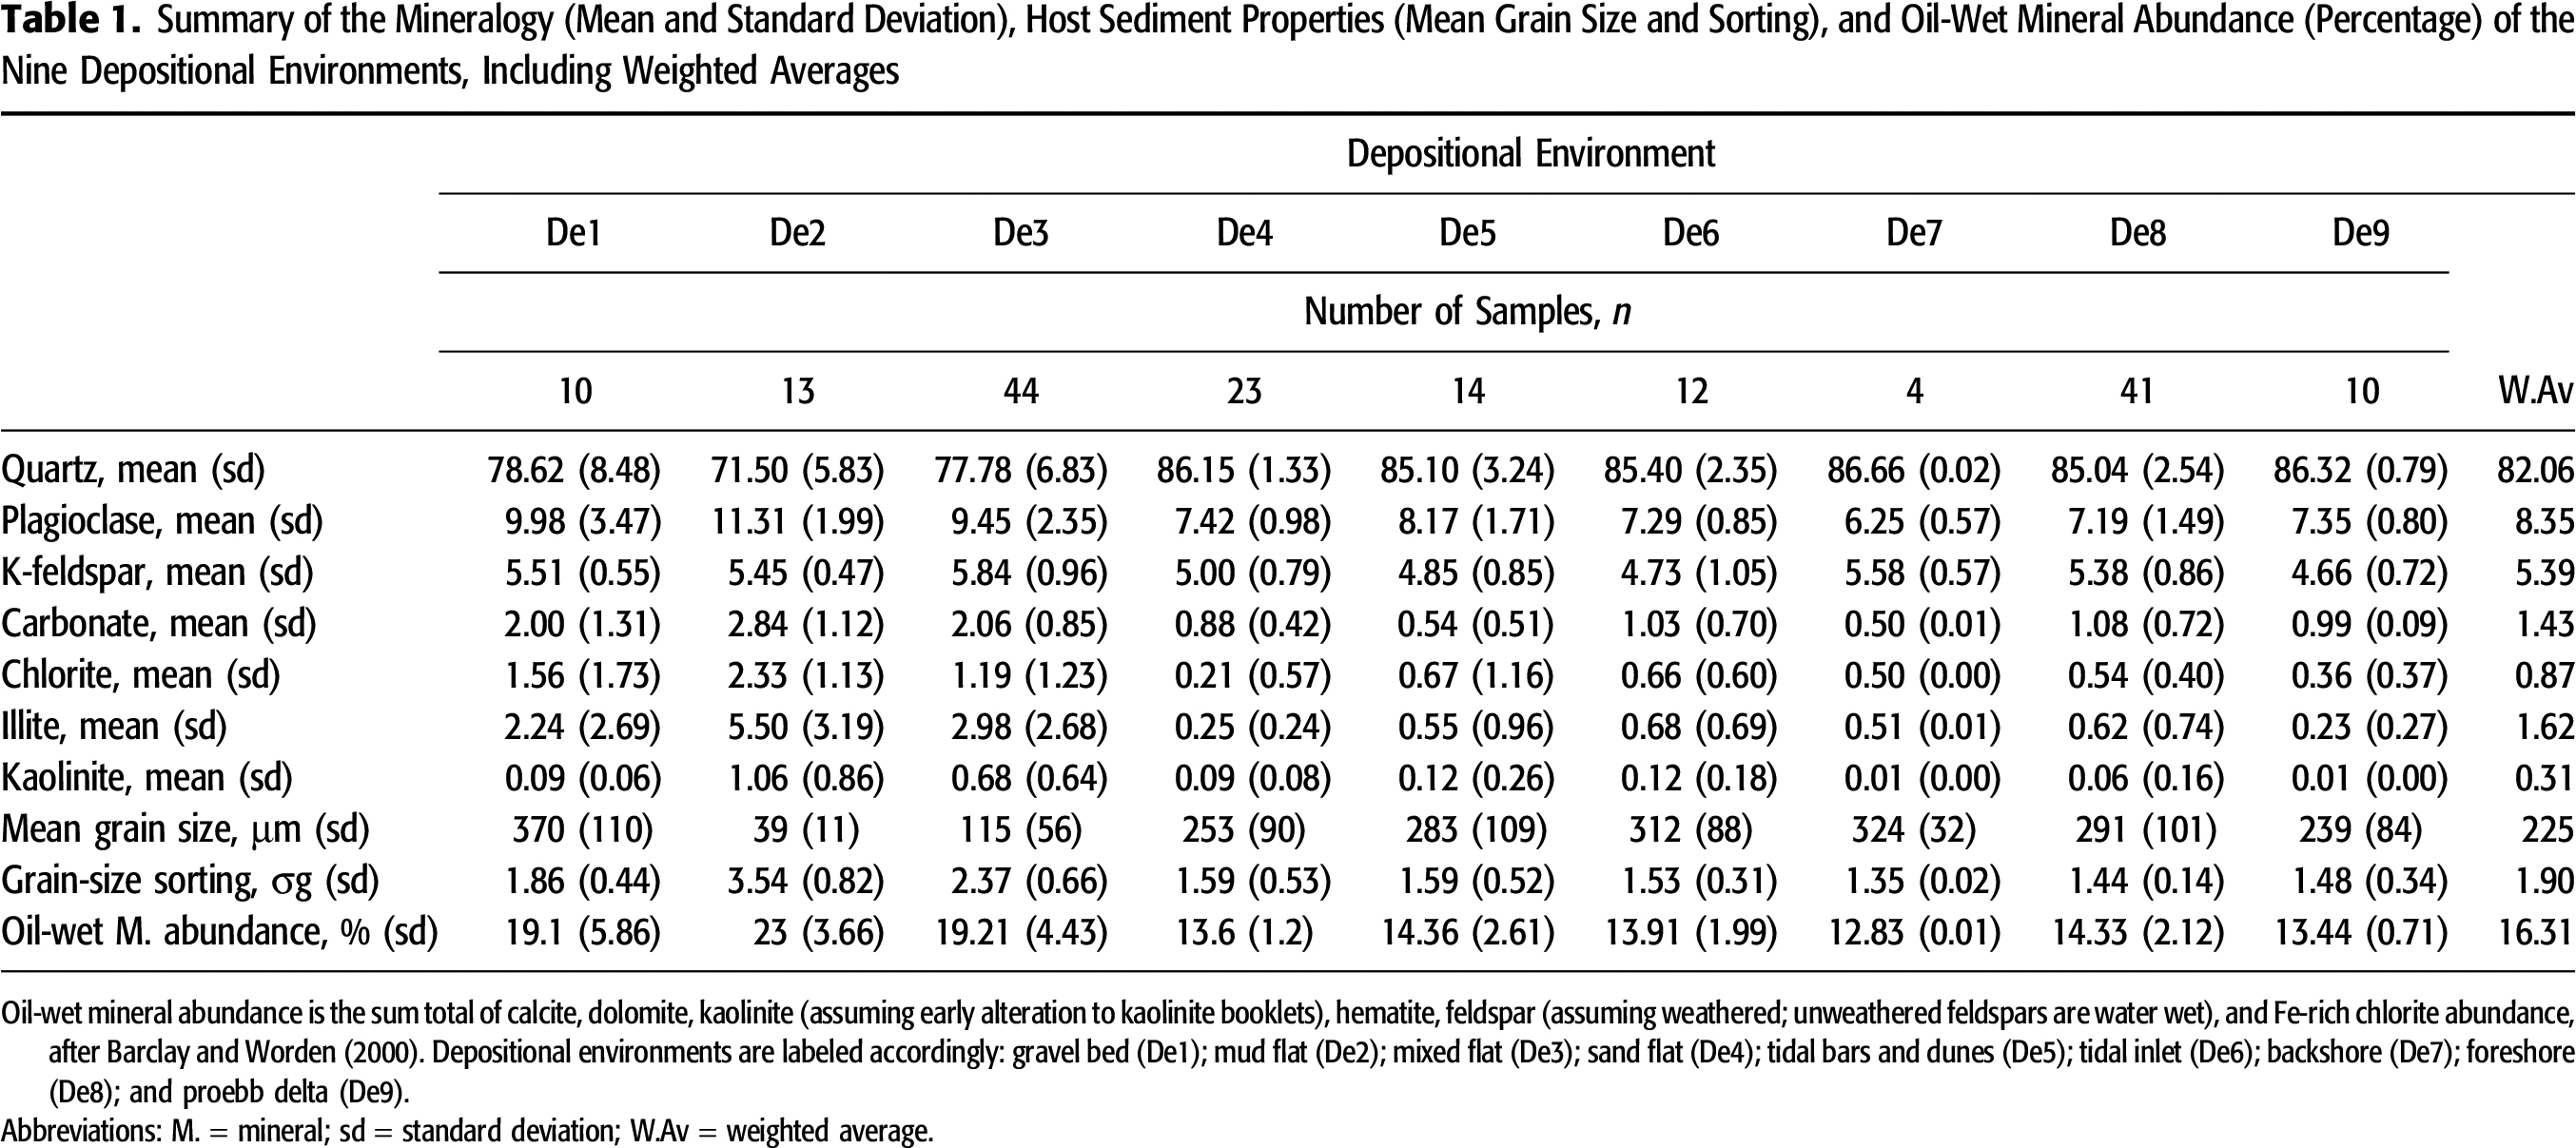

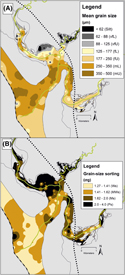 Figure 4. Distribution of host sediment properties: (A) mean grain size and (B) grain-size sorting. Note that textural maturity and mean grain size decrease toward the margins of the inner estuary and central basin. Mean grain-size classes are labeled accordingly: silt; lower very fine sand (vfL); upper very fine sand (vfU); lower fine sand (fL); upper fine sand (fU); lower medium sand (mL); and upper medium sand (mU). Grain-size sorting classes are labeled accordingly: well sorted (Ws); moderately well sorted (MWs); moderately sorted (Ms); and poorly sorted (Ps).
 Figure 5. Host sediment properties as a function of estuarine zone and depositional environment. (A) Mean grain size as a function of estuarine zone, (B) grain-size sorting as a function of estuarine zone, (C) mean grain size as a function of depositional environment, and (D) grain-size sorting as a function of depositional environment. Grain-size sorting classes are as follows: 1.27–1.41 (well sorted); 1.41–1.62 (moderately well sorted [MWs]); 1.62–2.0 (moderately sorted); 2.0–4.0 (poorly sorted); and 4–16 (very poorly sorted). Note that textural maturity and mean grain size decrease toward the margins of the inner estuary and central basin (i.e., in mud flats and mixed flats). Estuarine zones are labeled accordingly: lower Irt (A); lower Mite (B); lower Esk (C); inner Irt (D); inner Mite (E); inner Esk (F); central basin (G); and outer estuary (H). Depositional environments are labeled accordingly: gravel bed (De1); mud flat (De2); mixed flat (De3); sand flat (De4); tidal bars and dunes (De5); tidal inlet (De6); backshore (De7); foreshore (De8); and proebb delta (De9). Note that outliers (open circles) are defined as an observation that is numerically distant from the rest of the data (i.e., a value that is 1.5 times the interquartile range below the lower quartile and above the upper quartile).
Estuarine Composition
Here, XRD studies, as opposed to petrographic techniques, have been used to quantify mineralogy. It is therefore not possible to create traditional QFL ternary diagrams, which have typically been used to classify sandstones (Folk, 1954) and in provenance studies (Dickinson and Suczek, 1979). However, our SEM-EDS analyses have revealed that clay minerals, especially chlorite, occur in the silt- and sand-size fraction as lithic fragments as well in the clay fraction of the sediment (Figure 6A). As a result, XRD-QFL ternary plots (Figure 7) closely compare with traditional petrographic QFL plots and reveal the relative abundance of quartz, feldspar, and lithic grains that are enriched in clay minerals. Figure 7 reveals that the relative abundance of QFL varies as a function of estuarine zone.
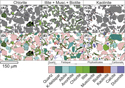 Figure 6. Quantitative evaluation of minerals by scanning electron microscopy (QEMSCAN®) analyzing the micron-scale (2-μm) texture and chemical and mineralogical composition of a single central basin sample. (A–C) The textural characteristics of chlorite, illite, biotite, and kaolinite are shown. Only the clay minerals chlorite, illite, or kaolinite are colored. (D–F) The textural characteristics of all framework grains and matrix minerals are shown. All minerals are colored. Note that lithic fragments are typically chlorite rich. Musc. = muscovite.
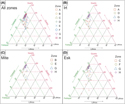 Figure 7. X-ray diffraction quartz, feldspar, and lithics (QFL) ternary plots; lithics are here defined as the sum total of clay minerals (chlorite, illite, kaolinite, and smectite) in the silt and sand fraction. (A) The QFL distribution throughout all estuarine zones; (B) River Irt, inner Irt, central basin, and outer-estuarine composition; (C) River Mite, inner Mite, central basin, and outer-estuarine composition; (D) River Esk, inner Esk, central basin, and outer-estuarine composition. Note that River Esk sediment is relatively feldspathic and enriched in lithics (most likely chlorite). Estuarine zones are labeled accordingly: lower Irt (A); lower Mite (B); lower Esk (C); inner Irt (D); inner Mite (E); inner Esk (F); central basin (G); and outer estuary (H).
Composition of Drift Deposits
Data on XRD have been produced from (1) drift deposits exposed in the cliff sections in the inner Esk (Gosforth Glaciogenic Formation and Seascale Glaciogenic Formation) and (2) the Ravenglass Till Member (part of the Seascale Glaciogenic Formation). Ravenglass Till Member samples (n = 3) have the following mineral assemblage: quartz (65%–75%), plagioclase (8%–14%), K-feldspar (6%), chlorite (2%–3%), illite (6%–8%), and kaolinite (5%). The Ravenglass Till Member is dominated by well-crystalline, Fe–Mg-enriched illite (Esquevin index: 0.28; illite crystallinity: 0.24). The Fishgarth Wood Till Member (part of the Gosforth Glaciogenic Formation) (n = 1) has the following mineral assemblage: quartz (81%), plagioclase (7%), K-feldspar (6%), chlorite (<0.5%), illite (5%), and kaolinite (1%). The Fishgarth Wood Till Member is dominated by Al-enriched illite (Esquevin index: 0.43; illite crystallinity: 0.21).
Mineral Abundance and Grain-Size Fraction
To determine whether different minerals are preferentially most abundant within different grain-size fractions, a whole-sediment sample from the Saltcoats mixed flat was split into grain-size fractions and analyzed using XRD. The proportion of minerals in each grain-size fraction is shown in Figure 8A. Quartz abundance increases with an increase in grain size (Figure 8A). The K-feldspar abundance appears to be independent of grain size (Figure 8A). Plagioclase is most abundant in fine to coarse silt-size sediment (∼2 to ∼63 μm; Figure 8A). The abundance of clay minerals (chlorite, illite, and kaolinite) and carbonate (mostly calcite) decreases with an increase in grain size (Figure 8A).
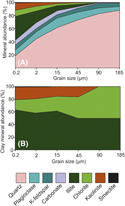 Figure 8. Relative abundance of specific minerals as a function of grain-size class, extracted from a singular disaggregated (e.g., clay minerals removed from the surface of sand grains) central basin whole-sediment sample. (A) Whole mineral assemblage. (B) Relative proportions of chlorite, illite, kaolinite, and smectite. Note that chlorite is relatively most abundant in coarser-grained sediment in comparison with illite, kaolinite, and smectite.
Chlorite, illite, kaolinite, and smectite abundance have been plotted as a function of grain-size fraction to assess if the relative abundance of specific clay minerals varies between grain-size fractions (Figure 8B). Relative chlorite abundance typically increases with an increase in grain size; the relative abundance of illite and kaolinite decreases with an increase in grain size (Figure 8B). Smectite abundance is negligible and is largely restricted to sediment fractions less than 15 μm in size (Figure 8B).
Mapped Estuarine Mineral Distribution
The mapped distributions of quartz, plagioclase, K-feldspar, and carbonate are presented in Figure 9. Quartz abundance ranges from 64% to 90% and typically increases in abundance toward the open sea (Figure 9A). Quartz is most abundant (∼90%) in outer-estuarine (tidal inlet, foreshore, and backshore) sediment and least abundant (∼64%) toward the margin of the inner estuary and the central basin (Figure 9A).
 Figure 9. Mapped mineral distribution patterns in the Ravenglass Estuary, United Kingdom. (A) Quartz, (B) plagioclase, (C) K-feldspar, and (D) total carbonate. Note that plagioclase and carbonate abundance increase toward the margin of the inner estuary and central basin. Sediment is most quartz rich in outer-estuarine sediment. A slight depletion in K-feldspar is observed in the tidal inlet.
Plagioclase abundance ranges from 6% to 15% and increases in abundance with proximity to the fluvial–marine interface and toward the margin of the inner estuary and central basin (Figure 9B). Variations in K-feldspar abundance (3%–8%) are relatively minor throughout the Ravenglass Estuary, but there is a minor reduction in K-feldspar abundance in tidal inlet and northern foreshore sediment (Figure 9C).
Carbonate abundance ranges from 0% to 5% (of which >95% is calcite, <5% is aragonite, and <1% is dolomite) and increases in abundance toward the margin of the inner estuary and central basin (Figure 9D). Carbonate material is least abundant upon the northern foreshore and in the tidal inlet (Figure 9D).
The mapped distributions of clay fraction abundance and the abundance of specific clay minerals are displayed in Figure 10. Clay-size material is most abundant toward the estuarine margins in the inner estuary and the central basin and is negligible in the outer estuary (<0.5%). Chlorite is most abundant in Saltcoats tidal flat sediment and has a relatively patchy distribution throughout the inner estuary zones (Figure 10B). Illite is most abundant in Saltcoats tidal flat and has a relatively patchy distribution throughout the inner estuary zones (Figure 10C). Kaolinite, of minor abundance, is predominantly found in mud flats (Figure 10D).
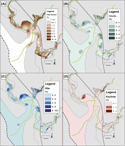 Figure 10. Mapped clay fraction (<2 μm) and clay mineral distribution patterns in the Ravenglass Estuary, United Kingdom. (A) Clay fraction, (B) chlorite, (C) illite, and (D) kaolinite. Note that outer-estuarine sediment has a paucity of clay-size material (<0.5%). Illite, chlorite, and kaolinite are most abundant in mud flats and mixed flats; chlorite abundance is elevated in some tidal bar and dune samples (because of a presence of chlorite lithics; see Figures 6A, 12B).
Mineral Abundance versus Mean Grain Size
The relationships between mean grain size and the abundance of quartz, K-feldspar, plagioclase, and carbonate, as a function of depositional environment, are presented in Figure 11.
 Figure 11. The relationship between specific mineral abundance and mean grain size, colored as a function of depositional environment. (A) Quartz, (B) plagioclase, (C) K-feldspar, and (D) carbonate. Note that quartz abundance increases with an increase in mean grain size, whereas plagioclase and carbonate abundance typically decrease. The K-feldspar abundance slightly decreases with an increase in mean grain size. Depositional environments are labeled accordingly: gravel bed (De1); mud flat (De2); mixed flat (De3); sand flat (De4); tidal bars and dunes (De5); tidal inlet (De6); backshore (De7); foreshore (De8); and proebb delta (De9). Mean grain-size classes are labeled accordingly: silt; lower very fine sand (vfL); upper very fine sand (vfU); lower fine sand (fL); upper fine sand (fU); lower medium sand (mL); upper medium sand (mU); and lower coarse sand (cL).
Quartz has uniformly high abundance (∼85%) in sediment between upper fine sand (>177 μm) and medium upper sand (<350 μm). Between the grain-size classes silt to upper fine sand (62–177 μm), in mixed-flat sediments, quartz abundance typically increases with an increase in mean grain size (Figure 11A). Gravel beds have a wide range of quartz abundance (Figure 11A). Note that quartz abundance in mud flats is relatively low (∼65%–80%) but does not correlate to mean grain size.
Between the grain-size classes silt to upper very fine sand (62–125 μm), plagioclase abundance typically decreases with an increase in mean grain size (Figure 11B). Plagioclase has lower abundance (∼6%–8%) in sediment between upper fine sand and medium upper sand (125–350 μm). Gravel beds have a wide range of plagioclase abundance (Figure 11B). Note that plagioclase abundance in mud flats is relatively high (∼8%–14%) but does not correlate with mean grain size.
With an increase in mean grain size, there is a subtle reduction in K-feldspar abundance (Figure 11C); the highest abundance is found in some mixed-flat sediments (7%–8%), and the lowest abundance is found in sediment with a grain size greater than 350 μm in tidal inlets and the foreshore (3%–4%). However, most depositional environments have a K-feldspar abundance of approximately 5%–6%.
Between the grain-size classes silt to upper fine sand (primarily mixed flats), carbonate abundance typically increases with a reduction in mean grain size (Figure 11D). Carbonate is most abundant (∼2%–4%) in sediment that has a mean grain size less than upper fine sand (177 μm; Figure 11D). Carbonate abundance is relatively uniform (∼1%) in sediment that has a grain size greater than upper fine sand (177 μm). Gravel beds and mud flats have a wide range of carbonate abundance that shows no relationship to grain size (Figure 11D).
The relationships between mean grain size and the abundance of clay fraction in estuarine sediments as well as the abundance of specific clay minerals (chlorite, illite, and kaolinite), as a function of depositional environment, are presented in Figure 12.
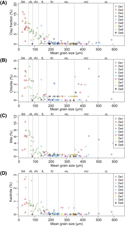 Figure 12. The relationship between clay fraction (<2 μm) and clay mineral abundance with mean grain size, colored as a function of depositional environment. (A) Clay fraction, (B) chlorite, (C) illite, and (D) kaolinite. Note that coarser-grained outer-estuarine sediment has a paucity of clay-size material (<0.5%). Illite, chlorite, and kaolinite abundance increase with a decrease in mean grain size (i.e., in mud flats and mixed flats). Chlorite lithics (see Figure 6B) are likely to explain elevated chlorite abundance in tidal dunes and bars despite relatively low clay fraction content. Depositional environments are labeled accordingly: gravel bed (De1); mud flat (De2); mixed flat (De3); sand flat (De4); tidal bars and dunes (De5); tidal inlet (De6); backshore (De7); foreshore (De8); and proebb delta (De9). Mean grain-size classes are labeled accordingly: silt; lower very fine sand (vfL); upper very fine sand (vfU); lower fine sand (fL); upper fine sand (fU); lower medium sand (mL); upper medium sand (mU); and lower coarse sand (cL).
Clay fraction abundance decreases with mean grain size in sediment up to upper fine sand (177 μm; Figure 12A). Clay fraction abundance is uniform (typically <1%) in sediment coarser than 177 μm. Clay fraction is most abundant in mud flats and mixed flats; all other depositional environments (De3 to De9) typically contain low concentrations of clay-size material (typically <1%).
Chlorite abundance typically decreases with an increase in mean grain size, with a sharp decrease in chlorite abundance in sediment that has a mean grain size greater than lower very fine sand (88 μm; Figure 12B). Elevated chlorite concentrations also occur in some foreshore, tidal inlet, tidal dune, and tidal bar sediments (Figure 12B). Chlorite abundance typically increases with an increase in grain size in tidal inlet (De6) and foreshore sediment (De8; Figure 12B). Gravel beds and mud flats have a wide range of chlorite abundance that shows no relationship to grain size (Figure 12B).
Illite abundance typically decreases with an increase in mean grain size (Figure 12C). A sharp increase in illite abundance is observed in sediment with a mean grain size of less than lower very fine sand (88 μm) (Figure 12C). Illite abundance is typically low (<2%) and shows no relationship with mean grain size in sediment that is coarser than upper fine sand (177 μm) (Figure 12C). Gravel beds and mud-flats have a wide range of illite abundance that shows no relationship to grain size (Figure 12C).
In mud flats and mixed flats, there is a minor decrease in kaolinite abundance (1%–3%) with increasing mean grain size (Figure 12C). The majority of depositional environments show kaolinite abundance is minor (<1%) and has no relationship with mean grain size.
Illite Composition and Crystallinity versus Mean Grain Size
The clay mineral assemblage of the Ravenglass Estuary is dominated by Fe–Mg-rich illite (Figures 10D, 13A). Illite composition and crystallinity have been plotted against mean grain size as a function of depositional environments in Figure 13A and B, respectively.
 Figure 13. The relationship between (A) illite chemistry (Esquevin index) and (B) illite crystallinity (full width at half maximum of the 10 Å peak) and mean grain size. Note that illite crystallinity and illite Fe–Mg content is reduced with an increase in mean grain size (i.e., in outer-estuarine sediment). Depositional environments are labeled accordingly: gravel bed (De1); mud flat (De2); mixed flat (De3); sand flat (De4); tidal bars and dunes (De5); tidal inlet (De6); backshore (De7); foreshore (De8); and proebb delta (De9). Mean grain-size classes are labeled accordingly: silt; lower very fine sand (vfL); upper very fine sand (vfU); lower fine sand (fL); upper fine sand (fU); lower medium sand (mL); upper medium sand (mU); and lower coarse sand (cL).
In sediment with grain size finer than upper fine sand (177 μm), illite is typically Fe–Mg rich and relatively well crystalline. In sediment coarser than upper fine sand, illite has a wide range of crystallinity values and compositions (Figure 13A, B). Foreshore sediment is primarily composed of poorly crystalline (illite crystallinity index: >0.25) and relatively Fe–Mg-depleted (Esquevin index: >0.30) illite.
Mineral Abundance: Estuarine Zones and Depositional Environments
Average mineral abundances of the nine depositional environments and eight estuary zones are presented in Tables 1 and 2 as well as the relative abundance of each clay mineral (e.g., chlorite/[chlorite + illite + kaolinite]) for the entire estuary. Box-and-whisker plots display the ranges and standard deviations as well as the median values for each specific mineral as a function of depositional environment and estuarine zones (Figures 14, 15). The abundance of preferentially oil-wet minerals (calcite, dolomite, kaolinite, hematite, Fe-rich chlorite, and weathered feldspar) per depositional environment and estuarine zone is presented in Tables 1 and 2 and displayed as box-and-whisker plots in Figure 15G, H.
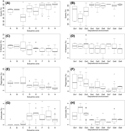 Figure 14. Specific mineral abundance as a function of estuarine zone and depositional environment: (A, B) quartz, (C, D) K-feldspar, (E, F) plagioclase, and (G, H) carbonate. Estuarine zones are labeled accordingly: lower Irt (A); lower Mite (B); lower Esk (C); inner Irt (D); inner Mite (E); inner Esk (F); central basin (G); and outer estuary (H). Depositional environments are labeled accordingly: gravel bed (De1); mud flat (De2); mixed flat (De3); sand flat (De4); tidal bars and dunes (De5); tidal inlet (De6); backshore (De7); foreshore (De8); and proebb delta (De9). Note that outliers (open circles) are defined as an observation that is numerically distant from the rest of the data (i.e., a value that is 1.5 times the interquartile range below the lower quartile and above the upper quartile).
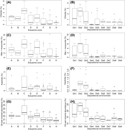 Figure 15. Specific clay mineral abundance and oil-wet mineral abundance as a function of estuarine zone and depositional environment: (A, B) Chlorite, (C, D) illite, (E, F) kaolinite, and (G, H) oil-wet mineral abundance calculated as the sum total of calcite, dolomite, kaolinite (assuming early alteration to kaolinite booklets), hematite, feldspar (assuming weathered; unweathered feldspars are water wet), and Fe-rich chlorite abundance, after Barclay and Worden (2000). Estuarine zones are labeled accordingly: lower Irt (A); lower Mite (B); lower Esk (C); inner Irt (D); inner Mite (E); inner Esk (F); central basin (G); and outer estuary (H). Depositional environments are labeled accordingly: gravel bed (De1); mud flat (De2); mixed flat (De3); sand flat (De4); tidal bars and dunes (De5); tidal inlet (De6); backshore (De7); foreshore (De8); and proebb delta (De9). Note that outliers (open circles) are defined as an observation that is numerically distant from the rest of the data (i.e., a value that is 1.5 times the interquartile range below the lower quartile and above the upper quartile).
The ANOVA results show that there is a statistically significant difference (p < 0.05) in relative mineral abundance as a function of both estuarine zone and depositional environment. The multicomparison, post hoc Tukey HSD results reveal statistical differences (p < 0.05) in mineral abundance between paired estuarine zones and depositional environments (Tables 3–6).
DISCUSSION
Controls on the composition (mineral assemblage) of the Ravenglass Estuary as well as the controls on QFL-C distribution patterns are discussed in this section. Influences on mineral distribution patterns that are here discussed include provenance and sediment transport pathways, estuarine hydrodynamics, and early diagenesis (both in situ diagenesis and continued mineral alteration during sediment transport).
Controls on Estuarine Sediment Composition
In the Ravenglass Estuary, there are three potential sources of sediment: (1) fluvial drainage of bedrock in the hinterland (Figure 2A); (2) fluvial drainage and local erosion of drift and soil deposits in the hinterland, underlying the estuary and exposed in proximal cliff sections (Figure 2B); and (3) marine inundation with landward displacement of littoral-zone sediment into the estuary.
The empirical relationships between composition of sands (QFL; based on sandstone petrology), provenance, and the plate-tectonic setting of the sedimentary basin was first established by Dickinson and Suczek (1979). The “Dickinson model” was later revised to improve predictive capabilities using the additive log-ratio transformation by Weltje (2006). Because whole-sediment (QFL-C) mineralogy data, instead of petrographic QFL data, are here reported, it is not possible to follow the methodology outlined by Dickinson and Suczek (1979) or Weltje (2006). However, XRD data, unlike petrographic QFL data, can reveal Esquevin indices (Esquevin, 1969) and illite crystallinity (Kübler, 1964) values that may be used to identify possible sediment source areas and transport pathways (Gingele et al., 2001; Oliveira et al., 2002; Borchers et al., 2011; Bout-Roumazeilles et al., 2013; Armynot du Châtelet et al., 2016).
The sediment composition of the Ravenglass Estuary is arkosic to subarkosic (Figure 7), which is likely to reflect the drainage of the Eskdale Intrusions and Borrowdale Volcanic Group in the hinterland, in agreement with predictive models produced by Dickinson and Suczek (1979). In the hinterland of the Ravenglass Estuary, there are no carbonate rocks and no carbonate-rich drift deposits. As a result, carbonate material is likely to have been primarily derived from gravel beds that have been partly colonized by shell beds in the inner Esk (autochthonous) and derived from offshore (allochthonous). Detrital, chlorite-bearing lithics have been reported to be pyroxene pseudomorphs in the Borrowdale Volcanic Group (Quirke et al., 2015) and the result of chloritization of mafic silicates in the Eskdale Intrusions (Moseley, 1978; Young et al., 1986; Quirke et al., 2015). As a result, chlorite-bearing lithics in the Ravenglass Estuary (Figure 6A) are likely to have been sourced from the Borrowdale Volcanic Group and chloritized areas of the Eskdale Intrusions, both of which have been reworked and incorporated into overlying Quaternary drift deposits (Merritt and Auton, 2000).
Illite that is Fe–Mg rich and relatively well crystalline (Figure 13), which dominates sediment that is finer than upper fine sand (<177 μm), is likely sourced from the Ravenglass Till Member because such values are typical of physically eroded, unweathered rocks (and therefore till; Chamley, 1989). In contrast, sediment that is coarser than upper fine sand (>177 μm) contains illite that has a wide range of crystallinity values and compositions (Figures 13A, B); this is characteristic of both chemically weathered rocks that have lost divalent cations (Fe and Mg) and physically eroded, unweathered rocks (Chamley, 1989).
Results of XRD analysis show that rigid framework grains (e.g., quartz) and brittle minerals (e.g., feldspar) are present in high abundance in both the clay and silt fraction of drift deposits; this is probably caused by extensive subglacial comminution. The relatively high concentration of quartz in the clay and silt fraction of Ravenglass Estuary sediment is probably in contrast to other nonglaciated sedimentary basins that are typically depleted in quartz in the finest sediments (Odom et al., 1976). Furthermore, the Ravenglass Till Member may also be an important source of plagioclase, with abundances of up to 14%.
Controls on Mineral Distribution Patterns
Provenance Controls and Sediment Transport Pathways
Provenance studies (based on sandstone composition) may be undertaken to unravel and characterize the complex history that has led to the production and the evolution of sediments, from initial weathering and erosion in the source sediment area and passing through to sediment transport and temporary storage and finally burial and lithification (Caracciolo et al., 2012). For example, the vertical (stratified) differences in plagioclase content were reported to reflect differences in sediment provenance in the Statfjord Formation, Gullfaks field (Dalland et al., 1995).
It is noteworthy that grain-size dependence of sediment composition may lead to bias in provenance studies (Garzanti et al., 2009). However, despite River Irt and Mite (northern drainage basin) sediment having a comparable mean grain size (Figure 5A), River Esk sediment (southern drainage basin) is relatively chlorite and feldspar rich (Figure 15A). The enrichment of feldspar and chlorite may reflect the drainage of chloritic and feldspathic Eskdale Intrusions, which is primarily restricted to the River Esk drainage basin (south of Muncaster Fell; Figure 1). An important outcome of this study is that, despite the Rivers Irt and Esk having different fluvial sediment compositions, counterpart inner-estuarine zones (inner Irt, zone D; inner Esk, zone F) show no statistical difference in composition (Tables 3–6). Thus provenance signals have been removed, presumably because of intense estuarine mixing (likely caused by the macrotidal regime and short estuarine length) and possible dilution by a second estuarine mineral assemblage (e.g., internal erosion of glacial deposits throughout the estuary).
Hydrodynamic Controls, Mechanical Breakdown, and Physical Sorting of Minerals by Grain Size
The findings of Odom et al. (1976) are commonly invoked to explain mineral distribution patterns in many sandstone reservoirs. Odom et al. (1976) reported that feldspar abundance and distribution in a range of sandstones was controlled by the degree of sediment abrasion (grain size), transport processes, and depositional environment. Results presented by Odom et al. (1976) show that feldspar tends to be concentrated in the fraction of the sediment less than 125 μm (upper very fine sand) or, in some cases, the coarse silt fraction. Field and Pilkey (1969) showed that feldspar, in shelf and beach sands, is concentrated in the fine and very fine sand fractions as a result of intense abrasion. In agreement with results from Odom et al. (1976), plagioclase abundance in Ravenglass sediment significantly decreases in abundance above a critical grain-size threshold of 125 μm. Odom et al. (1976) hypothesized that 125 μm represents a threshold below which feldspar tends to be less susceptible to further size reduction by abrasion. However, results of this study show that plagioclase is susceptible to grain-size reduction less than 125 μm, most likely caused by extensive subglacial comminution (Figure 11). Consequently, plagioclase typically continues to increase in abundance with a reduction in mean grain size between the grain-size classes silt to upper very fine sand (62–125 μm). Glacial comminution has previously been shown to lead to both quartz and feldspar being concentrated in clay and silt fractions (Stevens, 1991). In contrast, K-feldspar appears to show little relationship with mean grain size and displays only a minor depletion in sediment upon the northern foreshore, where the sediment is typically coarser than upper fine sand (>250 μm). The depletion in K-feldspar and carbonate in northern foreshore sediment may reflect the dominant wave direction originating from the southwest.
Quartz, a rigid-framework grain, is relatively resistant to sediment abrasion and grain-size reduction in comparison to brittle-framework grains such as feldspars, carbonate, and clay minerals. Estuarine hydrodynamics cause the physical sorting of grains by size and consequently have led to a relatively uniform, high abundance (∼85%) of quartz in depositional environments composed of relatively coarse sediment (>177–350 μm). Depositional environments with a mean grain size between 62 and 177 μm typically show a progressive increase in quartz abundance with an increase in mean grain size.
Allochthonous (derived from offshore) carbonate material has likely suffered extensive abrasion caused by repeated wave action prior to being transported and deposited into the estuarine system. Equally, autochthonous carbonate (from gravel beds that are partly colonized by shell beds in the inner Esk) has likely experienced extensive reworking and abrasion by strong tidal currents. Consequently, carbonate (>95% calcite) material is most abundant in low-energy depositional environments, in sediment that has a mean grain size less than upper fine sand (177 μm) (Figure 11D). In contrast, in sediment that has a grain size greater than upper fine sand (177 μm), carbonate material will tend to be resuspended during marine inundation caused by tidal currents and wave action.
Chlorite, illite, and kaolinite, as expected, dominate the clay fraction of estuarine sediment and therefore have the greatest absolute abundance in relatively low-energy depositional environments (mud flats and mixed flats). However, relatively high-energy tidal dune, tidal bar, foreshore, and tidal inlet depositional environments locally contain elevated chlorite concentrations (Figure 12B). The enrichment in chlorite cannot be explained by an increase in clay-size material (Figure 12A) and instead probably reflects the accumulation of chlorite lithics (Figure 6A).
Early Mineral Alteration and Chemical Breakdown Controls
At the fluvial–marine interface, there is a merging of terrigenous sediment transported by low-salinity, relatively organic- and iron-rich continental waters with high-salinity marine conditions, which have high aqueous sulfate concentration and a locally high oxidation state (Boyle et al., 1974, 1977; Sholkovitz, 1978; Sholkovitz et al., 1978; Berner and Berner, 2012). Consequently, early mineral alteration is significant in marginal marine settings and remains a potential control on mineral distribution patterns in the Ravenglass Estuary. Based on high-resolution QEMSCAN (SEM-EDS imaging), Daneshvar and Worden (2018) reported that detrital K-feldspar grains are preferentially rimmed by neoformed illite, whereas plagioclase grains may be preferentially rimmed by neoformed kaolinite in the Ravenglass Estuary; this was suggested to be evidence for continued mineral alteration of the estuarine sediment. The concept of early mineral alteration in the Ravenglass Estuary remains possible; however, it should be noted that intense alteration of feldspars in the hinterland of the Ravenglass Estuary has been widely reported (Moseley, 1978; Young et al., 1986; Quirke et al., 2015). As a result, it is not impossible that kaolinized plagioclase and illitized K-feldspars may be an inherited feature of the sediment and not caused by continued weathering in the estuary.
SIGNIFICANCE: FACILITATING SANDSTONE RESERVOIR QUALITY PREDICTION DURING PETROLEUM EXPLORATION, APPRAISAL, AND FIELD DEVELOPMENT AND PRODUCTION
The economic viability of sandstone reservoirs can be assessed by prediction of (1) porosity, which controls petroleum in-place volumes, and (2) permeability, which controls the rate at which petroleum can be produced (Worden et al., 2018). Sandstone texture (e.g., grain size, grain-size sorting, and matrix content) and composition are major controls on the porosity, permeability, and wettability state of sandstone reservoirs (Beard and Weyl, 1973; Scherer, 1987a, b; Bloch, 1991; Ramm and Bjorlykke, 1994; Barclay and Worden, 2000). This study can be used by analogy to better predict compositional and textural variation in ancient and deeply buried estuarine sandstones, with knowledge of how primary depositional texture and mineralogy may alter during burial diagenesis.
Compositional and Textural Variation in the Ravenglass Estuary, United Kingdom: Implications for Reservoir Quality and Provenance Signals in Estuarine Sandstones
The proportion of framework grain types is widely reported to significantly impact the diagenetic evolution and reservoir quality of sandstones (Morad et al., 2010). For example, feldspar and plutonic rock fragment dissolution may lead to the formation of intergranular and moldic pores during eo- and mesodiagenesis, creating secondary porosity and enhancing reservoir quality (Morad et al., 2010). As a result, based upon the hinterland geology, sedimentary provenance models enable broadly accurate predictions of sandstone composition during hydrocarbon exploration, field appraisal, and development (Dickinson and Suczek, 1979; Weltje, 2006; Garzanti et al., 2009). For example, the Dickinson model (Dickinson and Suczek, 1979) may be used during hydrocarbon exploration to make general predictions on sediment composition; however, it does not lend itself easily to other applications, such as regional studies of multisource basin fills (Weltje, 2006). In addition, petrographic QFL studies may fail to distinguish between glacial and nonglacial derived sediments, unlike XRD provenance studies that reveal Esquevin indices, which have proven to be a provenance indicator in the Ravenglass Estuary (Figure 13). However, it is possible that Esquevin index and illite crystallinity data sets may not be appropriate when studying sandstones that may have commenced illite alteration during burial.
Results of this study have shown that fluvial sediments in the Rivers Irt, Mite, and Esk broadly reflect the drainage of different bedrocks, soil types, and drift deposits and therefore have different sediment compositions (Figure 7). For example, River Esk sediment is relatively feldspathic and chlorite enriched (Figures 14, 15). However, the proportions of minerals in sediment in the counterpart inner-estuarine zones (i.e., inner Esk and inner Irt) are relatively uniform (Tables 4, 6). The dilution of provenance signals in Ravenglass inner-estuarine zones is most likely caused by intense mixing promoted by strong tidal currents and a short estuarine length. Consequently, reservoir quality studies of mixed-energy turbulent estuarine sandstones may benefit from removing provenance signals from inner-estuarine zones and instead focus on modeling the redistribution of specific minerals based on likely estuarine hydrodynamics and typical subsequent diagenetic pathways.
Compositional and Textural Variation in the Ravenglass Estuary, United Kingdom: Implications for the Diagenetic Alteration and Reservoir Quality of Estuarine Sandstones
Several studies, such as Morad et al. (2010) and Worden and Morad (2003), have shown that there is a finite number of common processes that may lead to the alteration of primary depositional mineralogy and texture during burial diagenesis. In this section, results from the Ravenglass Estuary have been used to predict the distribution of sandstone reservoir quality in ancient and deeply buried estuarine sandstone reservoirs in the eodiagenetic (<2000 m [<6562 ft]; <60°C–70°C) and mesodiagenetic (>2000 m [>6562 ft]; >60°C–70°C) realms (Figure 16).
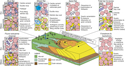 Figure 16. Summary schematic to facilitate reservoir quality prediction based upon compositional variation in the wave- and tide-dominated Ravenglass Estuary, United Kingdom and likely eo- and mesodiagenetic pathways, after Worden and Morad (2003) and Morad et al. (2010). Oil-wet mineral abundance is the sum total of calcite, dolomite, kaolinite (assuming early alteration to kaolinite booklets), hematite, feldspar (assuming weathered; unweathered feldspars are water wet), and Fe-rich chlorite abundance, after Barclay and Worden (2000). Detrital clay coat coverage (precursor to authigenic clay coats during mesodiagenesis) is based on previous studies in the Ravenglass Estuary (Wooldridge et al., 2017a, b, 2018). For each depositional environment, a schematic petrographic image (A–L) under eodiagenetic (<2000 m [<6562 ft]; <60°C–70°C) and mesodiagenetic (>2000 m [>6562 ft]; >60°C70°C) conditions (above and below, respectively), is shown. The subsurface part of the block diagram is modified from Dalrymple et al. (1992).
Eodiagenesis: Impact on Estuarine Sandstone Reservoir Quality
During eodiagenesis, an abundance of ductile grains will promote mechanical compaction and pseudomatrix formation (Scherer, 1987a, b; Bloch, 1991; Ramm and Bjorlykke, 1994; Worden et al., 2000; Morad et al., 2010). As a result, relatively low primary porosity values associated with poorly sorted and fine-grained sediment (Beard and Weyl, 1973), such as mud- and mixed-flat sediments, are likely to experience rapid loss of porosity and permeability during eodiagenesis because of an abundance of ductile grains (Figure 16A–D).
Meteoric water flushing, which can lead to the dissolution and kaolinization of reactive silicate minerals (primarily feldspars) (Glasmann et al., 1989), is particularly common in estuaries (especially at the head of the estuary, away from marine influence) because marginal marine systems are highly sensitive to relative sea-level changes (Ketzer et al., 2003; Worden and Burley, 2003; Morad et al., 2010, 2012). Because mud flats, mixed flats, and River Esk sediments contain an abundance of feldspars and a rich stew of reactive silicate minerals, they are likely to contain enhanced secondary porosity; authigenic kaolinite booklets may, however, occlude porosity (Figure 16).
K-feldspar overgrowths may occlude porosity and diminish permeability; however, they typically form in such low quantities that they rarely impact reservoir quality (Morad et al., 2010). Moreover, K-feldspar abundance is relatively evenly distributed in the Ravenglass Estuary (Figures 9C, 14C, D).
Large volumes of early carbonate cement can obliterate porosity and have commonly been observed in foreshore and backshore sandstones, leading to the term beachrock (Kantorowicz et al., 1987). However, porosity may be enhanced because of the subsequent formation of intragranular and moldic pores through the dissolution of carbonate grains; this is most likely to occur in carbonate-enriched mud flats and mixed flats (Figure 16). Furthermore, early carbonate cement may increase the mechanical strength of sediments (Morris et al., 2006) and may therefore preserve remaining porosity during subsequent compaction. As a result, better reservoir quality may be found in estuarine depositional environments that initially contained a small, but as yet undefined (“Goldilocks” scenario), amount of carbonate material.
In the Ravenglass Estuary, biofilm-mediated detrital clay coats are most extensive in mud flats and mixed flats, with only partial coatings present on sand grains in sand flats, tidal bars, and dunes; detrital clay coats are almost entirely absent in outer-estuarine sediment (Wooldridge et al., 2017a, b, 2018). Detrital clay coat development in the primary depositional environment, and via eodiagenetic processes, (e.g., infiltration [Matlack et al., 1989]), is important because porosity-preserving authigenic clay coats are reported to form through the thermally driven recrystallization of detrital clay coats (Ehrenberg, 1993) as well as through the in situ growth from the authigenic alteration of detrital precursors and eodiagenetic phases (Hillier, 1994; Aagaard et al., 2000; Worden and Morad, 2003; Ajdukiewicz and Larese, 2012). The impact of detrital and authigenic clay coats is further discussed in the subsequent section.
Mesodiagenesis: Impact on Estuarine Sandstone Reservoir Quality
During mesodiagenesis, one of the major controls on reservoir quality is the transition from quartz being relatively inert and relatively unreactive to becoming more soluble as a result of increased effective stress and burial temperatures in excess of 80°C–100°C (Worden and Burley, 2003; Worden et al., 2018).
Quartz cementation is likely to be most extensive in mud flats and mixed flats that host an abundance of micas and illite, which promote quartz cementation and pressure dissolution at grain contacts (Oelkers et al., 1996; Meyer et al., 2006; Trewin and Fallick, 2009), as well as quartz-rich depositional environments (Walderhaug, 1994a, b), such as outer-estuarine sediments.
In contrast, chlorite and mixed illite/chlorite clay coats may preserve porosity through the inhibition of quartz cementation (Ehrenberg, 1993; Dowey et al., 2012; Stricker et al., 2016; Stricker and Jones, 2018). Therefore, the reservoir quality of the Ravenglass Estuary, if it was to be buried to temperatures exceeding 80°C–100°C, would largely depend on whether detrital clay coats (Wooldridge et al., 2017a, b, 2018) formed chlorite clay coats and enhanced reservoir quality or formed illite clay coats and promoted quartz cementation and pressure dissolution. Chlorite clay coats are most likely to form in inner-estuarine tidal bars and dunes because of an enrichment of detrital chlorite (Figure 12C) and sufficient clay content to form clay coats, reported to be as little as 1%–2% of the rock volume by Bloch et al. (2002).
In the Ravenglass Estuary, plagioclase is most abundant in fluvial and mud- and mixed-flat sediments (Figures 11C, 14E). As a result, by analogy, plagioclase albitization, which may provide small amounts of carbonate and clay mineral cements (Morad et al., 2010), is likely to be most extensive in fluvial and tidal flat sandstones. In contrast, K-feldspar is relatively evenly distributed throughout the Ravenglass Estuary, and therefore, any diagenetic processes requiring K-feldspar are not likely to be facies dependent.
Enhanced secondary porosity caused by the dissolution of detrital carbonate grains and eodiagenetic calcite cement is likely to be most significant in carbonate-rich depositional environments (i.e., tidal flats; Figure 11D).
Compositional Variation in the Ravenglass Estuary, United Kingdom: Implications for Reservoir Wettability
Wettability is defined as the tendency of a fluid, in the presence of another (immiscible) fluid, to spread along a solid surface (Crocker and Marchin, 1988). Whether a reservoir rock is primarily water wet (water bound to the surface of grains) or oil wet (oil bound to the surface of grains) may have significant implication for economic viability (e.g., petroleum in-place and diagenetic processes, such as the extent of quartz cementation [Barclay and Worden, 2000]). Controls on wettability in sandstone reservoirs include petroleum composition, reservoir mineralogy, pressure, and temperature (Barclay and Worden, 2000). As a result, compositional variations in the Ravenglass Estuary may be used, by analogy, to facilitate the prediction of the spatial distribution and type of wettability states in estuarine sandstones. The spatial distribution of oil-wet mineral abundance, calculated as the sum total of calcite, dolomite, kaolinite, hematite, and Fe-rich chlorite abundance (after Barclay and Worden, 2000), are presented in Tables 1 and 2 and Figures 15G, H and 16. Results show that the mud flats and mixed flats contain the highest abundance of oil-wet minerals in the primary depositional environment. We acknowledge that wettability state may alter during burial diagenesis (e.g., extensive quartz cementation and the illitization of kaolinite and dioctahedral smectite may lead to sandstones becoming more water wet with time).
CONCLUSIONS
This study has revealed the dominant controls on compositional variation in modern estuarine sands. Key findings of this research may be used, by analogy, to better predict the distribution of primary depositional minerals and burial diagenetic pathways in sandstone reservoirs. The main conclusions are summarized below.
1. The Ravenglass Estuary is composed of arkosic to subarkosic sediments, which reflects the drainage of the major underlying lithologies, namely Eskdale Intrusions, Borrowdale Volcanic Group, and Sherwood Sandstone Group.
2. The clay mineral assemblage of the Ravenglass Estuary is dominated by Fe–Mg-rich and well-crystalline illite, derived primarily from the glacial till. Chlorite lithics are relatively abundant in coarser-grained sediment, likely derived from pyroxene pseudomorphs in the Borrowdale Volcanic Group and chloritized mafic silicates in the Eskdale Intrusions.
3. Quartz abundance typically increases with increasing grain size up to a critical grain-size threshold of upper fine sand (177 μm); sediment coarser than 177 μm has relatively high and uniform quartz abundance. Plagioclase and carbonate abundance typically decrease with increasing grain size, with a critical grain-size threshold of lower fine sand (125 μm); sediment that is coarser than 125 μm typically has a relatively low abundance of plagioclase and carbonate. The K-feldspar abundance is generally uniformly distributed, with a slight depletion in sediment with a grain size coarser than lower medium sand (350 μm). Clay-size fraction and kaolinite abundance decrease with increasing grain size, with a critical grain-size threshold of upper fine sand (177 μm). In sediment that is coarser than lower very fine sand (88 μm), there is a sharp decrease in chlorite and illite abundance. It is noteworthy that high chlorite concentrations, present as lithic fragments, may also occur in some foreshore, tidal inlet, tidal dune, and tidal bar sediments.
4. Mineral distribution patterns in the Ravenglass Estuary are primarily controlled by the grain size of specific minerals and estuarine hydrodynamics. The grain sizes of specific minerals are controlled by the mineral’s strength and history of abrasion (e.g., glacial comminution). Provenance signals present in fluvial sediments (e.g., chlorite- and feldspar-rich River Esk sediments) are lost by intense estuarine mixing once sediment has been transported past the fluvial–marine interface.
5. This study has shown that the distribution of primary depositional mineralogy (in terms of QFL-C) may be predicted as a function of depositional environment and mean grain size. As a result, with knowledge of burial diagenetic pathways, this study may be used, by analogy, to facilitate the spatial prediction of sandstone composition and reservoir quality in similar estuarine sandstones.
REFERENCES CITED
Aagaard, P., J. S. Jahren, A. O. Harstad, O. Nilsen, and M. Ramm, 2000, Formation of grain-coating chlorite in sandstones. Laboratory synthesized vs. natural occurrences: Clay Minerals, v. 35, no. 1, p. 261–269, doi:10.1180/000985500546639.
Ajdukiewicz, J. M., and R. H. Lander, 2010, Sandstone reservoir quality prediction: The state of the art: AAPG Bulletin, v. 94, no. 8, p. 1083–1091, doi:10.1306/intro060110.
Ajdukiewicz, J. M., and R. E. Larese, 2012, How clay grain coats inhibit quartz cement and preserve porosity in deeply buried sandstones: Observations and experiments: AAPG Bulletin, v. 96, no. 11, p. 2091–2119, doi:10.1306/02211211075.
Armynot du Châtelet, E., V. Bout-Roumazeilles, R. Coccioni, F. Frontalini, F. Francescangeli, G. Margaritelli, R. Rettori, F. Spagnoli, F. Semprucci, and A. Trentesaux, 2016, Environmental control on a land–sea transitional setting: Integrated sedimentological, geochemical and faunal approaches: Environmental Earth Sciences, v. 75, no. 2, p. 123–141, doi:10.1007/s12665-015-4957-7.
Assinder, D. J., M. Kelly, and S. R. Aston, 1985, Tidal variations in dissolved and particulate phase radionuclide activities in the Esk Estuary, England, and their distribution coefficients and particulate activity fractions: Journal of Environmental Radioactivity, v. 2, no. 1, p. 1–22, doi:10.1016/0265-931X(85)90022-0.
Barclay, S. A., and R. H. Worden, 2000, Effects of reservoir wettability on quartz cementation in oil fields, in R. H. Worden and S. Morad, eds., Quartz cementation in sandstones: Oxford, United Kingdom, International Association of Sedimentologists Special Publication 29, p. 103–118, doi:10.1002/9781444304237.ch8.
Beard, D. C., and P. K. Weyl, 1973, Influence of texture on porosity and permeability of unconsolidated sand: AAPG Bulletin, v. 57, no. 2, p. 349–369.
Berner, E. K., and R. A. Berner, 2012, Global environment: Water, air and geochemical cycles, 2nd ed.: Princeton, New Jersey, Princeton University Press, 444 p.
Bloch, S., 1991, Empirical prediction of porosity and permeability in sandstones: AAPG Bulletin, v. 75, no. 7, p. 1145–1160.
Bloch, S., R. H. Lander, and L. Bonnell, 2002, Anomalously high porosity and permeability in deeply buried sandstone reservoirs: Origin and predictability: AAPG Bulletin, v. 86, no. 2, p. 301–328.
Blott, S. J., and K. Pye, 2001, GRADISTAT: A grain size distribution and statistics package for the analysis of unconsolidated sediments: Earth Surface Processes and Landforms, v. 26, no. 11, p. 1237–1248, doi:10.1002/esp.261.
Borchers, A., I. Voigt, G. Kuhn, and B. Diekmann, 2011, Mineralogy of glaciomarine sediments from the Prydz Bay–Kerguelen region: Relation to modern depositional environments: Antarctic Science, v. 23, no. 2, p. 164–179, doi:10.1017/S0954102010000830.
Bousher, A., 1999, Ravenglass Estuary: Basic characteristics and evaluation of restoration options: RESTRAT-WP 1.4, Restrad-Td 12, draft issue 4: Whitehaven, United Kingdom, Westlakes Scientific Consulting, 74 p.
Bout-Roumazeilles, V., A. Riboulleau, E. A. Châtelet, L. Lorenzoni, N. Tribovillard, R. W. Murray, F. Müller-Karger, and Y. M. Astor, 2013, Clay mineralogy of surface sediments as a tool for deciphering river contributions to the Cariaco Basin (Venezuela): Journal of Geophysical Research: Oceans, v. 118, no. 2, p. 750–761, doi:10.1002/jgrc.20079.
Boyle, E., R. Collier, A. T. Dengler, J. M. Edmond, A. C. Ng, and R. F. Stallard, 1974, On the chemical mass-balance in estuaries: Geochimica et Cosmochimica Acta, v. 38, no. 11, p. 1719–1728, doi:10.1016/0016-7037(74)90188-4.
Boyle, E. A., J. M. Edmond, and E. R. Sholkovitz, 1977, The mechanism of iron removal in estuaries: Geochimica et Cosmochimica Acta, v. 41, no. 9, p. 1313–1324, doi:10.1016/0016-7037(77)90075-8.
Brockamp, O., and M. Zuther, 2004, Changes in clay mineral content of tidal flat sediments resulting from dike construction along the Lower Saxony coast of the North Sea, Germany: Sedimentology, v. 51, no. 3, p. 591–600, doi:10.1111/j.1365-3091.2004.00637.x.
Caracciolo, L., H. Von Eynatten, R. Tolosana-Delgado, S. Critelli, P. Manetti, and P. Marchev, 2012, Petrological, geochemical, and statistical analysis of Eocene–Oligocene sandstones of the Western Thrace Basin, Greece and Bulgaria: Journal of Sedimentary Research, v. 82, no. 7, p. 482–498, doi:10.2110/jsr.2012.31.
Carr, A. P., and M. W. L. Blackley, 1986, Implications of sedimentological and hydrological processes on the distribution of radionuclides: The example of a salt marsh near Ravenglass, Cumbria: Estuarine, Coastal and Shelf Science, v. 22, no. 5, p. 529–543, doi:10.1016/0272-7714(86)90012-0.
Chamley, H., 1989, Clay sedimentology: Berlin, Springer-Verlag, 561 p., doi:10.1007/978-3-642-85916-8.
Choquette, P. W., and L. Pray, 1970, Geologic nomenclature and classification of porosity in sedimentary carbonates: AAPG Bulletin, v. 54, no. 2, p. 207–250.
Chuhan, F. A., K. Bjorlykke, and C. J. Lowrey, 2001, Closed-system burial diagenesis in reservoir sandstones: Examples from the Garn Formation at Haltenbanken area, offshore mid-Norway: Journal of Sedimentary Research, v. 71, no. 1, p. 15–26, doi:10.1306/041100710015.
Chung, F. H., 1974a, Quantitative interpretation of x-ray diffraction patterns of mixtures: I. Matrix-flushing method for quantitative multicomponent analysis: Journal of Applied Crystallography, v. 7, no. 6, p. 519–525, doi:10.1107/S0021889874010375.
Chung, F. H., 1974b, Quantitative interpretation of x-ray diffraction patterns of mixtures: II. Adiabatic principle of x-ray diffraction analysis of mixtures: Journal of Applied Crystallography, v. 7, no. 6, p. 526–531, doi:10.1107/S0021889874010387.
Crocker, M. E., and L. M. Marchin, 1988, Wettability and adsorption characteristics of crude-oil asphaltene and polar fractions: Journal of Petroleum Technology, v. 40, no. 4, p. 470–474, doi:10.2118/14885-PA.
Dalland, A., E. W. Mearns, and J. J. McBride, 1995, The application of samarium-neodymium (Sm-Nd) provenance ages to correlation of biostratigraphically barren strata: A case study of the Statfjord Formation in the Gullfaks Oilfield, Norwegian North Sea, in R. E Dunay and E. A Hailwood, eds., Non-biostratigraphical methods of dating and correlation: Geological Society, London, Special Publications 1995, v. 89, p. 201–222, doi:10.1144/GSL.SP.1995.089.01.10.
Dalrymple, R. W., B. A. Zaitlin, and R. Boyd, 1992, Estuarine facies models: Conceptual models and stratigraphic implications: Journal of Sedimentary Petrology, v. 62, no. 6, p. 1130–1146, doi:10.1306/D4267A69-2B26-11D7-8648000102C1865D.
Daneshvar, E., 2015, Dissolved iron behavior in the Ravenglass Estuary waters, an implication on the early diagenesis: Universal Journal of Geoscience, v. 3, no. 1, p. 1–12, doi:10.13189/ujg.2015.030101.
Daneshvar, E., and R. H. Worden, 2018, Feldspar alteration and Fe minerals: Origin, distribution and implications for sandstone reservoir quality in estuarine sediments, in P. J. Armitage, A. R. Butcher, J. M. Churchill, A. E. Csoma, C. Hollis, R. H. Lander, J. E. Omma, and R. H. Worden, eds., Reservoir quality of clastic and carbonate rocks: Analysis, modelling and prediction: Geological Society, London, Special Publications 2018, v. 435, p. 123–139, doi:10.1144/SP435.17.
Dickinson, W. R., and C. A. Suczek, 1979, Plate tectonics and sandstone compositions: AAPG Bulletin, v. 63, no. 12, p. 2164–2182.
Dowey, P. J., D. M. Hodgson, and R. H. Worden, 2012, Pre-requisites, processes, and prediction of chlorite grain coatings in petroleum reservoirs: A review of subsurface examples: Marine and Petroleum Geology, v. 32, no. 1, p. 63–75, doi:10.1016/j.marpetgeo.2011.11.007.
Dutton, S. P., and R. G. Loucks, 2010, Diagenetic controls on evolution of porosity and permeability in lower Tertiary Wilcox sandstones from shallow to ultradeep (200–6700 m) burial, Gulf of Mexico Basin, U.S.A.: Marine and Petroleum Geology, v. 27, no. 1, p. 69–81, doi:10.1016/j.marpetgeo.2009.08.008.
Ehrenberg, S. N., 1993, Preservation of anomalously high porosity in deeply buried sandstones by grain-coating chlorite: Examples from the Norwegian continental shelf: AAPG Bulletin, v. 77, no. 7, p. 1260–1286.
Esquevin, J., 1969, Influence de la composition chimique des illites sur leur cristallinité [in French]: Bulletin Centre Recherche Elf Pau-SNPA, v. 3, p. 147–153.
Field, M. E., and O. H. Pilkey, 1969, Feldspar in Atlantic continental margin sands off the southeastern United States: Geological Society of America Bulletin, v. 80, no. 10, p. 2097–2102, doi:10.1130/0016-7606(1969)80[2097:FIACMS]2.0.CO;2.
Folk, R. L., 1954, The distinction between grain size and mineral composition in sedimentary-rock nomenclature: The Journal of Geology, v. 62, no. 4, p. 344–359, doi:10.1086/626171.
Folk, R. L., 1968, Petrology of sedimentary rocks: Austin, Texas, Hemphill Publishing, 179 p.
Folk, R. L., and W. C. Ward, 1957, Brazos river bar: A study in the significance of grain size parameters: Journal of Sedimentary Petrology, v. 27, no. 1, p. 3–26, doi:10.1306/74D70646-2B21-11D7-8648000102C1865D.
Garzanti, E., S. Andò, and G. Vezzoli, 2009, Grain-size dependence of sediment composition and environmental bias in provenance studies: Earth and Planetary Science Letters, v. 277, no. 3–4, p. 422–432, doi:10.1016/j.epsl.2008.11.007.
Gingele, F. X., P. De Deckker, and C.-D. Hillenbrand, 2001, Clay mineral distribution in surface sediments between Indonesia and NW Australia—Source and transport by ocean currents: Marine Geology, v. 179, no. 3–4, p. 135–146, doi:10.1016/S0025-3227(01)00194-3.
Glasmann, J. R., P. D. Lundegard, R. A. Clark, B. K. Penny, and I. D. Collins, 1989, Geochemical evidence for the history of diagenesis and fluid migration: Brent Sandstone, Heather Field, North Sea: Clay Minerals, v. 24, no. 2, p. 255–284, doi:10.1180/claymin.1989.024.2.10.
Griffiths, J., D. R. Faulkner, A. P. Edwards, and R. H. Worden, 2018, Deformation band development as a function of intrinsic host-rock properties in Triassic Sherwood Sandstone, in P. J. Armitage, A. R. Butcher, J. M. Churchill, A. E. Csoma, C. Hollis, R. H. Lander, J. E. Omma, and R. H. Worden, eds., Reservoir quality of clastic and carbonate rocks: Analysis, modelling and prediction: Geological Society, London, Special Publications 2018, v. 435, p. 161–176, doi:10.1144/SP435.11.
Grim, R. E., R. H. Bray, and W. F. Bradley, 1937, The mica in argillaceous sediments: American Mineralogist, v. 22, p. 813–829.
Hillier, S., 1994, Pore-lining chlorites in siliciclastic reservoir sandstones: Electron microprobe, SEM and XRD data, and implications for their origin: Clay Minerals, v. 29, no. 4, p. 665–679, doi:10.1180/claymin.1994.029.4.20.
Hillier, S., 2000, Accurate quantitative analysis of clay and other minerals in sandstones by XRD: Comparison of a Rietveld and a reference intensity ratio (RIR) method and the importance of sample preparation: Clay Minerals, v. 35, no. 1, p. 291–302, doi:10.1180/000985500546666.
Hillier, S., 2003, Quantitative analysis of clay and other minerals in sandstones by x-ray powder diffraction (XRPD), in R. H. Worden and S. Morad, eds., Clay mineral cements in sandstones: Oxford, United Kingdom, International Association of Sedimentologists Special Publication 34, p. 213–252.
Kantorowicz, J. D., I. D. Bryant, and J. M. Dawans, 1987, Controls on the permeability and distribution of carbonate cements in Jurassic sandstones: Bridgeport Sands, southern England, and Viking Group, Troll field, Norway, in Marshall, J. D., ed., Diagenesis of sedimentary sequences: Geological Society, London, Special Publications 1987, v. 36, p. 103–118.
Kelly, M., M. Emptage, S. Mudge, K. Bradshaw, and J. Hamilton-Taylor, 1991, The relationship between sediment and plutonium budgets in a small macrotidal estuary: Esk Estuary, Cumbria, UK: Journal of Environmental Radioactivity, v. 13, no. 1, p. 55–74, doi:10.1016/0265-931X(91)90039-I.
Ketzer, J. M., M. Holz, S. Morad, and I. Al‐Aasm, 2003, Sequence stratigraphic distribution of diagenetic alterations in coal‐bearing, paralic sandstones: Evidence from the Rio Bonito Formation (early Permian), southern Brazil: Sedimentology, v. 50, no. 5, p. 855–877, doi:10.1046/j.1365-3091.2003.00586.x.
Kübler, B., 1964, Les argiles, indicateurs de métamorphisme [in French]: Revue de l’Institut Français du Pétrole, v. 19, p. 1093–1112.
Lloyd, J. M., Y. Zong, P. Fish, and J. B. Innes, 2013, Holocene and lateglacial relative sea-level change in north‐west England: Implications for glacial isostatic adjustment models: Journal of Quaternary Science, v. 28, no. 1, p. 59–70, doi:10.1002/jqs.2587.
Matlack, K. S., D. W. Houseknecht, and K. R. Applin, 1989, Emplacement of clay into sand by infiltration: Journal of Sedimentary Petrology, v. 59, p. 77–87.
McDougall, D. A., 2001, The geomorphological impact of Loch Lomond (Younger Dryas) Stadial plateau icefields in the central Lake District, northwest England: Journal of Quaternary Science, v. 16, no. 6, p. 531–543, doi:10.1002/jqs.624.
Merritt, J. W., and C. A. Auton, 2000, An outline of the lithostratigraphy and depositional history of Quaternary deposits in the Sellafield district, west Cumbria: Proceedings of the Yorkshire Geological Society, v. 53, no. 2, p. 129–154, doi:10.1144/pygs.53.2.129.
Meyer, E. E., G. W. Greene, N. A. Alcantar, J. N. Israelachvili, and J. R. Boles, 2006, Experimental investigation of the dissolution of quartz by a muscovite mica surface: Implications for pressure solution: Journal of Geophysical Research. Solid Earth, v. 111, B08202, 4 p., doi:10.1029/2005JB004010.
Moore, D. M., and R. C. Reynolds, Jr., 1997, X-ray diffraction and the identification and analysis of clay minerals: New York, Oxford University Press, 378 p.
Morad, S., K. Al-Ramadan, J. M. Ketzer, and L. F. de Ros, 2010, The impact of diagenesis on the heterogeneity of sandstone reservoirs: A review of the role of depositional facies and sequence stratigraphy: AAPG Bulletin, v. 94, no. 8, p. 1267–1309, doi:10.1306/04211009178.
Morad, S., L. F. de Ros, J. P. Nystuen, and M. Bergan, 1998, Carbonate diagenesis and porosity evolution in sheet-flood sandstones: Evidence from the Middle and Lower Lunde Members (Triassic) in the Snorre Field, Norwegian North Sea, in Morad, S., ed., Carbonate cementation in sandstones: Oxford, United Kingdom, Distribution patterns and geochemical evolution: International Association of Sedimentologists Special Publication 26, p. 53–85, doi:10.1002/9781444304893.ch3.
Morad, S., J. M. Ketzer, and L. F. de Ros, 2000, Spatial and temporal distribution of diagenetic alterations in siliciclastic rocks: Implications for mass transfer in sedimentary basins: Sedimentology, v. 47, p. 95–120, doi:10.1046/j.1365-3091.2000.00007.x.
Morad, S., J. M. Ketzer, and L. F. de Ros, 2012, Linking diagenesis to sequence stratigraphy: Chinchester, United Kingdom, International Association of Sedimentologists Special Publication 45, 522 p.
Morris, J. E., G. J. Hampson, and H. D. Johnson, 2006, A sequence stratigraphic model for an intensely bioturbated shallow-marine sandstone: The Bridport Sand Formation, Wessex Basin, UK: Sedimentology, v. 53, no. 6, p. 1229–1263, doi:10.1111/j.1365-3091.2006.00811.x.
Moseley, F., 1978, The geology of the Lake District: Leeds, Yorkshire Geological Society, 284 p.
Odeh, R. E., and J. O. Evans, 1974, Algorithm AS 70: The percentage points of the normal distribution: Journal of the Royal Statistical Society. Series C, Applied Statistics, v. 23, p. 96–97.
Odom, I. E., T. W. Doe, and R. H. Dott, 1976, Nature of feldspar-grain size relations in some quartz-rich sandstones: Journal of Sedimentary Research, v. 46, p. 862–870.
Oelkers, E. H., P. A. Bjorkum, and W. M. Murphy, 1996, A petrographic and computational investigation of quartz cementation and porosity reduction in North Sea sandstones: American Journal of Science, v. 296, no. 4, p. 420–452, doi:10.2475/ajs.296.4.420.
Oliveira, A., F. Rocha, A. Rodrigues, J. Jouanneau, A. Dias, O. Weber, and C. Gomes, 2002, Clay minerals from the sedimentary cover from the Northwest Iberian shelf: Progress in Oceanography, v. 52, no. 2–4, p. 233–247, doi:10.1016/S0079-6611(02)00008-3.
Primmer, T. J., C. A. Cade, J. Evans, J. G. Gluyas, M. S. Hopkins, N. H. Oxtoby, P. C. Smalley, E. A. Warren, and R. H. Worden, 1997, Global patterns in sandstone diagenesis: Their application to reservoir quality prediction for petroleum exploration, in J. A. Kupecz, J. Gluyas, and S. Bloch, eds., Reservoir quality prediction in sandstones and carbonates: AAPG Memoir 69, p. 61–78.
Quirke, J., C. M. B. Henderson, R. A. D. Pattrick, K. M. Rosso, A. Dent, J. W. Sharples, and C. I. Pearce, 2015, Characterizing mineralogy and redox reactivity in potential host rocks for a UK geological disposal facility: Mineralogical Magazine, v. 79, no. 6, p. 1353–1367, doi:10.1180/minmag.2015.079.6.11.
R Core Team, 2016, R: A language and environment for statistical computing: Vienna, Austria, R Foundation for Statistical Computing, accessed February 15, 2019, https://www.R-project.org/.
Ramm, M., and K. Bjorlykke, 1994, Porosity/depth trends in reservoir sandstones: Assessing the quantitative effects of varying pore-pressure, temperature history and mineralogy, Norwegian shelf data: Clay Minerals, v. 29, p. 475–490, doi:10.1180/claymin.1994.029.4.07.
Ramm, M., A. W. Forsberg, and J. Jahren, 1997, Porosity-depth trends in deeply buried Upper Jurassic reservoirs in the Norwegian Central Graben: An example of porosity preservation beneath the normal economic basement by grain-coating microquartz, in J. A. Kupecz, J. Gluyas, and S. Bloch, eds., Reservoir quality prediction in sandstones and carbonates: AAPG Memoir 69, p. 177–200.
Rawling, G. C., and L. B. Goodwin, 2003, Cataclasis and particulate flow in faulted, poorly lithified sediments: Journal of Structural Geology, v. 25, no. 3, p. 317–331, doi:10.1016/S0191-8141(02)00041-X.
Rider, M., and M. Kennedy, 2011, The geological interpretation of well logs: Cambridge, Rider-French Consulting, 440 p.
Saïag, J., B. Brigaud, E. Portier, G. Desaubliaux, A. Bucherie, S. Miska, and M. Pagel, 2016, Sedimentological control on the diagenesis and reservoir quality of tidal sandstones of the Upper Cape Hay Formation (Permian, Bonaparte Basin, Australia): Marine and Petroleum Geology, v. 77, p. 597–624, doi:10.1016/j.marpetgeo.2016.07.002.
Scherer, M., 1987a, Erratum to “Parameters influencing porosity in sandstones: A model for sandstone porosity prediction” [AAPG Bulletin, v. 71, no. 5, p. 485–491]: AAPG Bulletin, v. 71, no. 12, p. 1508, doi:10.1306/703C80FB-1707-11D7-8645000102C1865D.
Scherer, M., 1987b, Parameters influencing porosity in sandstones: A model for sandstone porosity prediction: AAPG Bulletin, v. 71, no. 5, p. 485–491.
Schmid, S., R. H. Worden, and Q. J. Fisher, 2006, Sedimentary facies and the context of dolocrete in the Lower Triassic Sherwood Sandstone Group: Corrib Field west of Ireland: Sedimentary Geology, v. 187, no. 3–4, p. 205–227, doi:10.1016/j.sedgeo.2005.12.028.
Sholkovitz, E. R., 1978, The floculation of dissolved Fe, Mn, Al, Cu, Ni, Co and Cd during estuarine mixing: Earth and Planetary Science Letters, v. 41, no. 1, p. 77–86, doi:10.1016/0012-821X(78)90043-2.
Sholkovitz, E. R., E. A. Boyle, and N. B. Price, 1978, The removal of dissolved humic acids and iron during estuarine mixing: Earth and Planetary Science Letters, v. 40, no. 1, p. 130–136, doi:10.1016/0012-821X(78)90082-1.
Stevens, R. L., 1991, Grain-size distribution of quartz and feldspar extracts and implications for flocculation processes: Geo-Marine Letters, v. 11, no. 3–4, p. 162–165, doi:10.1007/BF02431004.
Stricker, S., and S. J. Jones, 2018, Enhanced porosity preservation by pore fluid overpressure and chlorite grain coatings in the Triassic Skagerrak, Central Graben, North Sea, UK, in P. J. Armitage, A. R. Butcher, J. M. Churchill, A. E. Csoma, C. Hollis, R. H. Lander, J. E. Omma, and R. H. Worden, eds., Reservoir quality of clastic and carbonate rocks: Analysis, modelling and prediction: Geological Society, London, Special Publications 2018, v. 435, p. 321–341, doi:10.1144/SP435.4.
Stricker, S., S. J. Jones, S. Sathar, L. Bowen, and N. Oxtoby, 2016, Exceptional reservoir quality in HPHT reservoir settings: Examples from the Skagerrak Formation of the Heron Cluster, North Sea, UK: Marine and Petroleum Geology, v. 77, p. 198–215, doi:10.1016/j.marpetgeo.2016.02.003.
Trewin, N. H., and A. E. Fallick, 2009, Quartz cement origins and budget in the Tumblagooda Sandstone, western Australia, in R. H. Worden and S. Morad, eds., Quartz cementation in sandstones: Oxford, United Kingdom, International Association of Sedimentologists Special Publication 29, p. 219–229.
Walderhaug, O., 1994a, Precipitation rates for quartz cement in sandstones determined by fluid-inclusion microthermometry and temperature-history modeling: Journal of Sedimentary Research, Section A, Sedimentary Petrology and Processes, v. 64, p. 324–333.
Walderhaug, O., 1994b, Temperatures of quartz cementation in Jurassic sandstones from the Norwegian continental shelf—Evidence from fluid inclusions: Journal of Sedimentary Research, Section A, Sedimentary Petrology and Processes, v. 64, p. 311–323.
Watson, D. F., and G. M. Philip, 1985, Comment on “A nonlinear empirical prescription for simultaneously interpolating and smoothing contours over an irregular grid” by F. Duggan: Computer Methods in Applied Mechanics and Engineering, v. 50, p. 195–198.
Weltje, G. J., 2006, Ternary sandstone composition and provenance: An evaluation of the ‘Dickinson model’, in A. Buccianti, G. Mateu-Figueras, and V. Pawlowsky-Glahn, eds., Compositional data analysis in the geosciences: From theory to practice: Geological Society, London, Special Publications 2006, v. 264, no. 1, p. 79–99, doi:10.1144/GSL.SP.2006.264.01.07.
Wooldridge, L. J., R. H. Worden, J. Griffiths, A. Thompson, and P. Chung, 2017a, Biofilm origin of clay-coated sand grains: Geology, v. 45, no. 10, p. 875–878, doi:10.1130/G39161.1.
Wooldridge, L. J., R. H. Worden, J. Griffiths, and J. E. P. Utley, 2017b, Clay-coated sand grains in petroleum reservoirs: Understanding their distribution via a modern analogue: Journal of Sedimentary Research, v. 87, no. 4, p. 338–352, doi:10.2110/jsr.2017.20.
Wooldridge, L. J., R. H. Worden, J. Griffiths, J. E. P. Utley, and A. Thompson, 2018, The origin of clay-coated sand grains and sediment heterogeneity in tidal flats: Sedimentary Geology, v. 373, p. 191–209, doi:10.1016/j.sedgeo.2018.06.004.
Worden, R. H., 2006, Dawsonite cement in the Triassic Lam Formation, Shabwa Basin, Yemen: A natural analogue for a potential mineral product of subsurface CO2 storage for greenhouse gas reduction: Marine and Petroleum Geology, v. 23, no. 1, p. 61–77, doi:10.1016/j.marpetgeo.2005.07.001.
Worden, R. H., P. J. Armitage, A. R. Butcher, J. M. Churchill, A. E. Csoma, C. Hollis, R. H. Lander, and J. E. Omma, 2018, Petroleum reservoir quality prediction: Overview and contrasting approaches from sandstone and carbonate communities, in P. J. Armitage, A. R. Butcher, J. M. Churchill, A. E. Csoma, C. Hollis, R. H. Lander, J. E. Omma, and R. H. Worden, eds., Reservoir quality of clastic and carbonate rocks: Analysis, modelling and prediction: Geological Society, London, Special Publications 2018, v. 435, p. 1–31.
Worden, R. H., and S. D. Burley, 2003, Sandstone diagenesis: The evolution from sand to stone, in R. H Worden and S. D Burley, eds., Sandstone diagenesis: Recent and ancient: Oxford, United Kingdom, International Association of Sedimentologists Reprint Series 4, p. 3–44. doi:10.1002/9781444304459.ch.
Worden, R. H., M. J. Mayall, and I. J. Evans, 1997, Predicting reservoir quality during exploration: Lithic grains, porosity and permeability in Tertiary clastics of the South China Sea basin, in A. J. Fraser, S. J. Matthews, and R. W. Murphy, eds., Petroleum geology of Southeast Asia: Geological Society, London, Special Publications 1997, v. 126, p. 107–115.
Worden, R. H., M. Mayall, and I. J. Evans, 2000, The effect of ductile-lithic sand grains and quartz cement on porosity and permeability in Oligocene and lower Miocene clastics, South China Sea: Prediction of reservoir quality: AAPG Bulletin, v. 84, no. 3, p. 345–359, doi:10.1306/C9EBCDE7-1735-11D7-8645000102C1865D.
Worden, R. H., and S. Morad, 2003, Clay minerals in sandstones: Controls on formation, distribution and evolution, in R. H. Worden and S. Morad, eds., Clay mineral cements in sandstones: Oxford, United Kingdom, International Association of Sedimentologists Special Publication 34, p. 3–41.
Young, B., N. J. Fortey, and P. H. A. Nancarrow, 1986, An occurrence of tungsten mineralisation in the Eskdale Intrusion, West Cumbria: Proceedings of the Yorkshire Geological Society, v. 46, no. 1, p. 15–21, doi:10.1144/pygs.46.1.15.
AUTHORS
Joshua Griffiths is a reservoir quality specialist at BP Exploration and an honorary lecturer in petroleum reservoir geoscience at the University of Liverpool. He gained his MESci in 2013 and his Ph.D. in 2018 from the University of Liverpool. Prior to joining BP, he took a postdoctoral position at the University of Liverpool, funded by Equinor, to improve reservoir quality prediction in the Smørbukk field, offshore mid-Norway. His research interests include reservoir quality, diagenesis, sedimentology of paralic reservoirs, and statistics.
Richard H. Worden is a professor of petroleum geology and geochemistry and leads the M.Sc. in petroleum reservoir geoscience at the University of Liverpool, United Kingdom. He gained his B.Sc. degree and his Ph.D. from Manchester University in the 1980s. Following a postdoctoral position in Edinburgh, Scotland, he worked for BP at their Sunbury-on-Thames site. He then took a lectureship at Queens University in Belfast, followed by a move to the University of Liverpool in 2000. His research interests include sandstone, mudstone, and carbonate petrology; diagenesis; reservoir quality; petrophysics and geochemistry; water–rock interaction; petroleum–rock interaction; thermochemical sulfate reduction; and the geology of CO2 subsurface disposal.
Luke Wooldridge received his geology master’s degree (MGeol [honours]) from the University of Leicester. His doctoral thesis was undertaken at the University of Liverpool and focused on establishing the origin of and a predictive framework for clay-coated grains in marginal marine systems. After his doctoral degree, Luke joined BP as a reservoir quality specialist. He has published five articles and coauthored four.
James E. P. Utley is a researcher in diagenesis, petroleum geology, applied mineralogy, and soils and clay mineralogy. He gained his master’s in earth science at the University of Liverpool in 2008, remaining as a research assistant working on petrology, x-ray diffraction, and QEMSCAN® analysis. James currently works on research projects in reservoir quality assessment, CO2 sequestration, and volcanology.
Robert A. Duller is a lecturer in sedimentary geology at the University of Liverpool, United Kingdom. He gained his B.Sc. degree from the University of Leicester in 2002 and his Ph.D. from Keele University in 2007. In 2007, he took up a postdoctoral position at the Cambridge Arctic Shelf Programme, and from 2008 to 2011 he was a research associate at Imperial College London. After a short research associate position at the University of Liverpool, he then took up the position of lecturer at the same institution in 2012. His research interests include sedimentation from catastrophic flow events, quantifying climatic and tectonic impacts on the sedimentary record, and the development of quantitative techniques for the field stratigrapher.
ACKNOWLEDGMENTS
This work was undertaken as part of the Chlorite Consortium at the University of Liverpool, sponsored by BP, Shell, Equinor, Eni, Chevron, Woodside, and Petrobras. We thank AAPG Editor Barry Katz, Gemma Barrie, Stuart Jones, Christopher Stevenson, and one anonymous reviewer for their detailed and constructive comments that have helped improve this manuscript. Special thanks are offered to FEI (now Thermo Fisher Scientific) for providing the QEMSCAN, with huge gratitude expressed to Alan Butcher for facilitating this provision.