The AAPG/Datapages Combined Publications Database
AAPG Bulletin
Full Text
![]() Click to view page images in PDF format.
Click to view page images in PDF format.
AAPG Bulletin, V.
DOI: 10.1306/06132522006
Porosity evolution of sandstone reservoirs in the Paleogene Shahejie Formation of the Zhanhua depression, Bohai Bay Basin
Xiaowen Guo,1 Yanqi Hua,2 Bin Wang,3 Zhi Yang,4 Zhiliang He,5 Tian Dong,6 Keyu Liu,7 and Sheng He8
1Key Laboratory of Tectonics and Petroleum Resources (China University of Geosciences), Ministry of Education, Wuhan, China; [email protected]
2Key Laboratory of Tectonics and Petroleum Resources (China University of Geosciences), Ministry of Education, Wuhan, China; present address: China National Offshore Oil Corporation (CNOOC) Ltd., Tianjin Branch, Tianjin, China; [email protected]
3Wuxi Research Institute of Petroleum Geology, Sinopec, Wuxi, China; [email protected]
4Research Institute of Petroleum Exploration and Development, Beijing, China; [email protected]
5Key Laboratory of Tectonics and Petroleum Resources (China University of Geosciences), Ministry of Education, Wuhan, China; .[email protected]
6Key Laboratory of Tectonics and Petroleum Resources (China University of Geosciences), Ministry of Education, Wuhan, China; .[email protected]
7School of Geosciences, China University of Petroleum (East China), Qingdao, China; Laboratory for Marine Mineral Resources, Qingdao National Laboratory for Marine Science and Technology, Qingdao, China; [email protected]
8Key Laboratory of Tectonics and Petroleum Resources (China University of Geosciences), Ministry of Education, Wuhan, China; [email protected]
ABSTRACT
The sandstone reservoirs in the third interval of the Paleogene Shahejie Formation are crucial to petroleum exploration in the Zhanhua depression. Factors controlling reservoir quality and porosity evolution were quantified by integrating petrographic observation, cathodoluminescence examination, scanning electron microscopy, fluid inclusion, x-ray diffraction, oxygen stable isotope, and basin modeling. The porosity of the sandstone reservoirs in the third interval of the Shahejie Formation are controlled by clay content, carbonate cementation, and oil emplacement. The sandstone reservoirs are divided into four types, according to porosity evolution. Type I reservoirs are characterized by a high clay content and low porosity, in which the porosity loss was primarily due to mechanical compaction during the eogenetic stage. Type II reservoirs are characterized by extensive carbonate cementation and low porosity. Carbonate cementation mainly occurred during the mesogenetic stage. We believe that type III reservoirs have higher porosity and lower carbonate cements than the type II reservoirs because of oil emplacement. Oil emplacement occurred during the late mesogenetic stage, which retarded later ankerite cementation. The effect of oil emplacement on reservoir quality depends on the timing with reference to diagenetic sequence. The type IV reservoirs with the least carbonate cements and the highest porosity are the best reservoirs. The controlling factors on reservoir quality and porosity evolution, as determined by this study, are useful for predicting high-quality reservoirs in the Zhanhua depression and other analogous rifted lacustrine basins.
INTRODUCTION
Sandstone reservoirs with sufficient porosity and permeability are essential to the success of hydrocarbon exploration and commercial development (Bloch et al., 2002; Taylor et al., 2010). It is important to predict the petrophysical property of sandstone reservoirs in a play before drilling (Molenaar et al., 2008). Sandstone reservoir quality may be controlled by many factors, such as primary sedimentary facies (e.g., grain size, sorting, detrital mineralogy, clay content), diagenetic processes (e.g., mechanical compaction, cementation, grain-coating clay, dissolution), and early oil emplacement and overpressure development (Bloch et al., 2002; Ajdukiewicz et al., 2010; Taylor et al., 2010; Worden et al., 2018; Li et al., 2020; Xia et al., 2020; Yang et al., 2020). The quality of sandstone reservoirs represents a reasonable consequence of a variable interplay of controlling factors with increasing temperature and burial depth (Taylor et al., 2010). There is a critical need to independently assess how rates of porosity loss with depth are affected by various controlling factors. Quantifying the impact of diagenetic processes responsible for petrophysical properties in sandstones has been addressed and applied in published literature (Ehrenberg, 1989; Hendry et al., 2000; Bloch et al., 2002). Establishing the porosity evolution of sandstone is essential for predicting petrophysical properties of sandstone reservoirs during petroleum exploration.
Although some previous studies revealed that there are no differences in porosity between oil zones and water zones (Aase et al., 1996; Bjorkum and Nadeau, 1998; Aase and Walderhaug, 2005; Taylor et al., 2010), oil emplacement in sandstone reservoirs is thought to be conducive to porosity preservation by retarding cementation, as demonstrated by both empirical data and theoretical models (Worden et al., 1998, 2018; Bloch et al., 2002; Marchand et al., 2002; Xia et al., 2020). Prior studies suggest two different ways that oil emplacement may either preserve or improve porosity: (1) by retarding carbonate and quartz cementation (Burley et al., 1989); and (2) dissolution of carbonate cements by organic acids (Cai et al., 2003). The effect of oil emplacement on cementation depends on the timing of oil emplacement in relation to other diagenetic processes. The earlier the oil emplacement occurs in the sandstone reservoir, the greater the degree of porosity preservation (Worden et al., 1998, 2018; Marchand et al., 2002). The combination of porosity evolution and oil emplacement can thus be used to effectively evaluate the influence of oil emplacement on porosity development in sandstone reservoirs. Previous studies about the impact of oil emplacement on reservoir quality mainly focused on reservoirs cemented by quartz (Molenaar et al., 2008; Worden et al., 1998, 2018; Xia et al., 2020). The relationship between oil emplacement and quality of sandstone reservoirs dominated by carbonate cementation has been less well documented.
The Zhanhua depression is a rifted lacustrine basin in the southern part of the Bohai Bay Basin, eastern China, where numerous large-medium-sized oil fields are discovered. The Bonan oil field is one of the largest oil fields in the Zhanhua depression, with proven reserves of 1029 million bbl. Black oil was mainly produced from the Paleogene Shahejie (Es) Formation, with depth from 2000 to 4200 m, temperature from 80°C to 147°C, and pore fluid pressure from 20 to 56 MPa. The sandstone reservoirs in the third interval (Es3) of the Es Formation in the Bonan oil field are the main potential reservoirs in the Zhanhua depression, and hydrocarbons are produced from small-scale fault and stratigraphic traps (Li et al., 2003; Jia et al., 2007). The Es3 sandstone reservoirs in the Bonan oil field are located adjacent to the main source rocks in the Zhanhua depression and received late oil emplacement (<5 Ma) (Liu et al., 2017; Han et al., 2020). The frequent interbedding nature of the sandstone with mudstone in the Es3 interval results in complex diagenesis, with carbonate cements being the dominated pore-filing material. However, the effect of depositional environment, diagenesis, and oil charge in the reservoir on the reservoir quality is not clear. The effect of late oil emplacement on the carbonate cements content and type are not documented. An in-depth understanding of factors controlling reservoir quality and porosity evolution of the Es3 sandstone reservoirs is thus helpful to predict high-quality sandstone reservoirs in the Zhanhua depression. The objectives of this study are to (1) identify major diagenetic processes in the Es3 sandstone reservoirs of the Bonan oil field; (2) determine the factors controlling reservoir quality; (3) analyze the relationship among carbonate cementation, oil emplacement, and reservoir quality; and (4) understand the porosity evolution of the Es3 sandstone reservoirs and determine the reservoir quality types.
GEOLOGICAL SETTING
The Zhanhua depression is located in the northern area of the Jiyang subbasin, Bohai Bay Basin, eastern China, which is a complex rifted lacustrine basin (Figure 1A, B). The widely developed normal faults divided the Zhanhua depression into six sags and four uplifts from west to east: the Shaojia sag, the Sikou sag, the Bonan sag, the Gubei sag, the Gunan-Fulin sag, the Kenxi sag, and the Yihezhuang, Chengdong, Chenjiazhuang, and Gudao uplifts (Figure 1C). Several oil fields are developed in the Zhanhua depression, such as the Bonan oil field, the Luojia oil field, and the Chengdong oil field. The Bonan oil field is located in the central part of the Bonan sag and is one of the largest oil fields in the Zhanhua depression (Figure 1C).
 Figure 1.
(A) Location of the Bohai Bay Basin in China. (B) Location of the Zhanhua depression in the Bohai Bay Basin. (C) Structural map of the Zhanhua depression and location of the section EE′, Bonan oil field and wells investigated. (D) Schematic section EE′ showing the structural configuration of the Bonan oil field, Zhanhua depression. Ed = Dongying; Es = Paleogene Shahejie; Es1 = first interval of Es; Es2 = second interval of Es; Es3 = third interval of Es; Es3l = lower part of Es3; Es3m = middle part of Es3; Es3u = upper part of Es3; Es4 = fourth interval of Es.
Figure 1.
(A) Location of the Bohai Bay Basin in China. (B) Location of the Zhanhua depression in the Bohai Bay Basin. (C) Structural map of the Zhanhua depression and location of the section EE′, Bonan oil field and wells investigated. (D) Schematic section EE′ showing the structural configuration of the Bonan oil field, Zhanhua depression. Ed = Dongying; Es = Paleogene Shahejie; Es1 = first interval of Es; Es2 = second interval of Es; Es3 = third interval of Es; Es3l = lower part of Es3; Es3m = middle part of Es3; Es3u = upper part of Es3; Es4 = fourth interval of Es.
The Zhanhua depression is mainly filled with Paleogene to Quaternary deposits, including the Kongdian (Ek), Es, Dongying (Ed), Guantao (Ng), Minghuazhen (Nm), and Pingyuan (Qp) Formations, from bottom to top (Figure 2). The Paleogene Es Formation can be subdivided into four intervals (Figure 2). The Es3 contains the main source rocks and clastic reservoirs, with depths ranging from 2500 to 5000 m (8202.1–16,404.2 ft) in the Bonan oil field, and can be further subdivided into an upper part (Es3u), a middle part (Es3m), and a lower part (Es3l). The clastic reservoirs in the Es3 interval of the Bonan oil field mainly comprise braided river delta sediments and turbidite sediments (Kang et al., 2002; Li et al., 2002). The source rocks of the Es3 interval consist primarily of lacustrine mudstones and oil shales, which are mainly located in the Es3l with type I and type II1 kerogen (Wang et al., 2005). The clastic reservoirs in the Es3 interval of the Bonan oil field are mainly defined as fault-block reservoir and stratigraphic trap (Figure 1D). Most of the sandstone reservoirs directly overlay the adjacent source rocks, and some reservoirs are interbedded with source rocks in the Es3 interval (Figure 1D). The oil in the sandstone reservoirs of the Es3 interval is mainly generated from the adjacent or underlying source rocks in the Es3l (Wang et al., 2005). The frequent interbedding between sandstone reservoirs and source rocks formed favorable assemblages of source rock-reservoir-sealing rock in the Bonan oil field (Figure 2).
 Figure 2.
Generalized stratigraphic column for the Paleogene sediments in the Zhanhua depression (modified from Wang et al., 2005).
Figure 2.
Generalized stratigraphic column for the Paleogene sediments in the Zhanhua depression (modified from Wang et al., 2005).
METHODS AND DATA SET
Petrographic observations were conducted on 51 core samples with depths of 2800 to 4000 m (9186.4 to 13,123.4 ft) from 12 boreholes drilled to the Es3 sandstone reservoirs of the Zhanhua depression. The locations of boreholes, which are distributed widely in the Bonan oil field, are shown in Figure 1C. The petrographic thin sections were impregnated with blue epoxy under vacuum pressure for visual porosity measurement and stained with Alizarin Red S for carbonate cement identification (Dickson, 1966). Point counting analysis was applied to all the samples to determine roundness, sorting, grain size, cement type, primary and secondary porosity, etc. (200 points per thin section). The petrographic analysis was performed on a Nikon transmitted-light microscope. Cathodoluminescence (CL) examination was performed on all 51 selected Es3 sandstone samples to identify carbonate cement composition and diagenetic sequence. The CL examination was conducted on a CL8200 Mk5 CL microscope with operating electron beam voltage of 30 KV.
Porosity loss from compaction (CoPL) and cementation (CePL) was estimated by using the statistical data from petrographic observation. The original porosity (Ope) was estimated as Ope = 20.91 + 22.9/σ, with σ being the Trask sorting index (Beard and Weyl, 1973). The CoPL and CePL were estimated with intergranular volume (IGV) and total cement volume (Cem) by equations 1 and 2 (Ehrenberg, 1989; Hendry et al., 2000). The IGV is calculated as the sum of intergranular porosity, matrix, and cements (Bloch et al., 2002).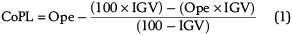

Six representative samples of the Es3 interval were analyzed by the x-ray diffraction (XRD) technique to identify the elemental composition. The selected sandstone samples were powdered to 200 mesh. The XRD analysis was conducted in an X’Pert Pro x-ray diffractometer with an operating voltage of 40 kV and a current of 40 mA.
To image the morphology and determine major element composition of carbonate cements, three representative samples from the Es3 interval were analyzed by using a ZEISS EVO LS15 environmental scanning electron microscope equipped with an energy-dispersive spectrometer (EDS). The samples were processed as thin sections, which were coated by carbon.
Four sandstone samples were selected for fluid inclusion analysis, including fluid inclusion petrographic analysis, fluorescence color observation, and microthermometry measurement with double-polished 100-μm-thick sections. Fluid inclusion observation was carried out under a transmitted white light Zeiss petrographic microscope combined with an incident ultraviolet light. Microthermometry measurement of fluid inclusions was conducted on a Linkam THMSG600 heating–cooling stage mounted on the ZEISS microscope. The values of homogenization temperature (Th) were recorded at a heating rate of 1°C/min with measurement precision of ±1°C.
Oxygen stable isotope analysis was conducted on eight sandstone samples in the Es3 interval that display a single type of carbonate cement. The composition of carbonate cement in each sample was determined by petrographic observation, XRD analysis, and CL examination. The bulk samples were first powdered to less than 200 mesh. Then, the powder samples were reacted with 100% phosphoric acid under vacuum. The reaction time and temperature were based on the carbonate cement type in the samples, which are 25°C and 1 hr for calcite and 50°C and 24 hr for dolomite and ankerite. The oxygen isotope analysis was conducted with a Thermo-Fisher MAT 253 isotope ratio mass spectrometer. The measurement precision was ±0.08‰ for oxygen. The oxygen stable isotope data were presented in δ notation relative to Vienna Peedee belemnite standards. The precipitation temperature of carbonate cement in the eight samples was calculated based on the oxygen isotope fractionation factor for calcite–water (equation 3) and for ankerite–water (equation 4) (Friedman and O’Neil, 1977):


where δ18Ocarbonate is the oxygen stable isotope of carbonate cements (standard mean ocean water [SMOW]), δ18Owater is the oxygen stable isotope of parental fluids, and T is the precipitation temperature of carbonate cements. With the burial depth and temperature increasing, the pore water can be modified by fluid–rock interaction such as feldspar dissolution, which can also make the δ18O value of pore water isotopically heavier (dos Anjos et al., 2000; Fayek et al., 2001). Previous studies in the Jiyang subbasin suggested an increase of δ18OSMOW value to 0.25‰ in pore water approximately at the depth of >2000 m (6561.7 ft), which was used to calculate the precipitation temperature of carbonate cements in the Es3 interval (Han et al., 2012; Yang et al., 2018).
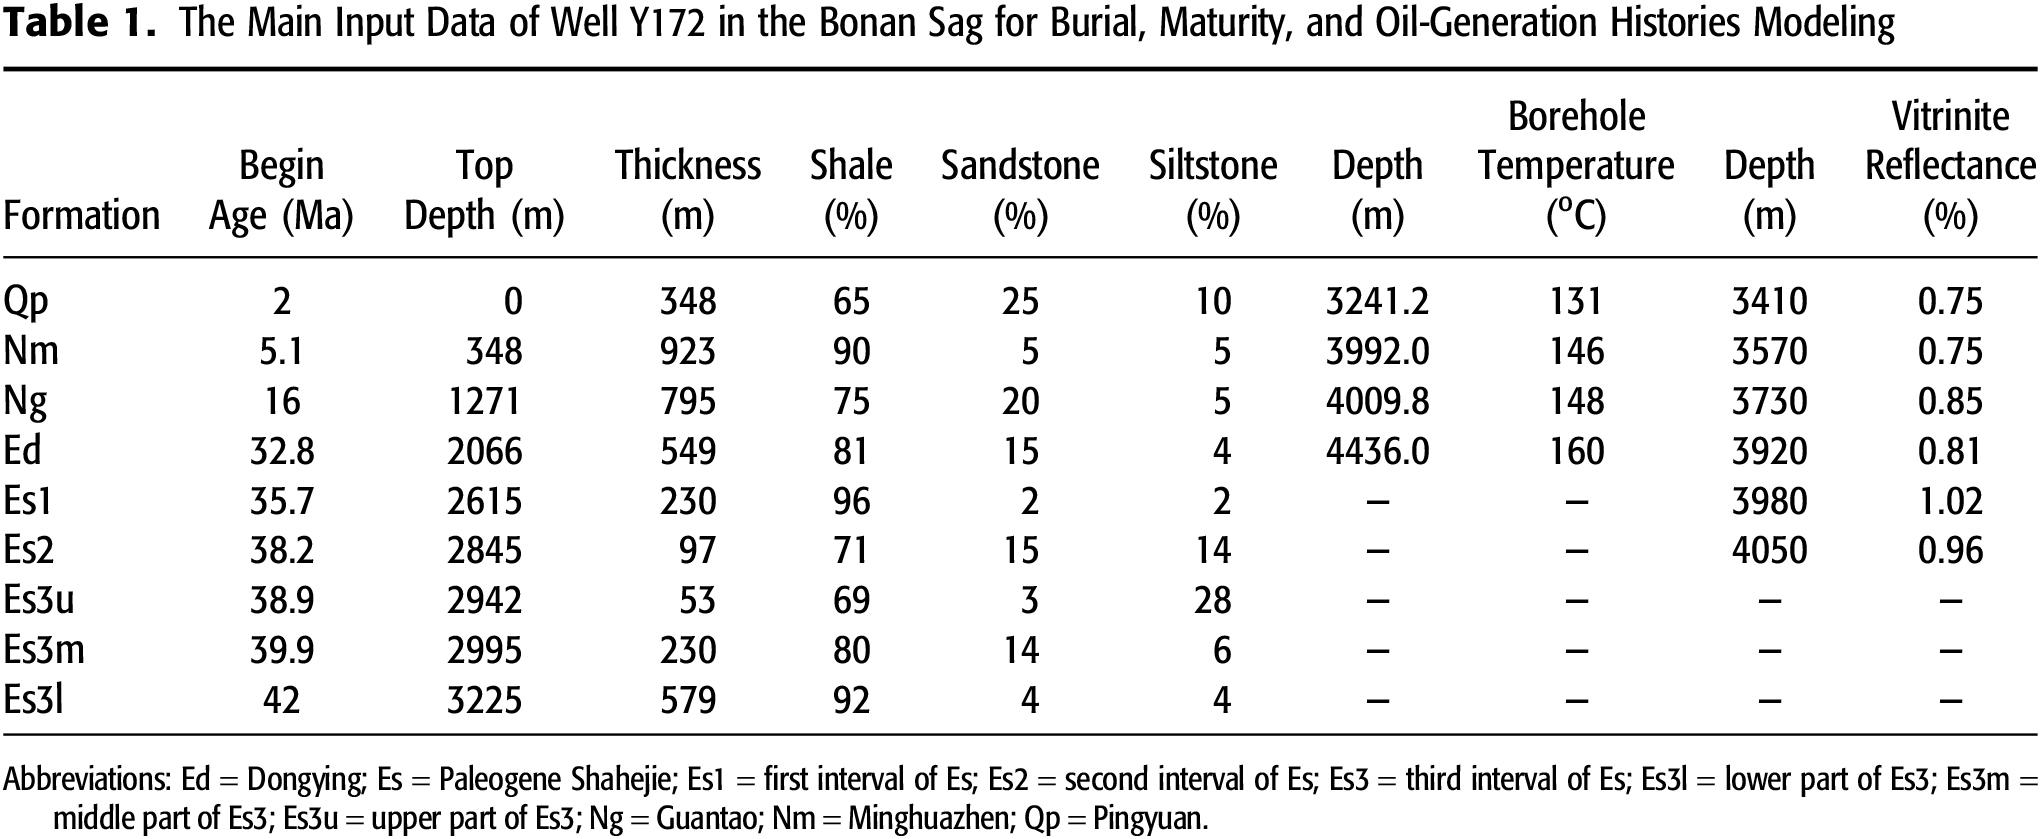
A representative well, Y172, located on the central Bonan sag in the Zhanhua depression (Figure 1), was selected to simulate the burial, maturity, and oil-generation histories of the Es3 interval using the BasinMod-1D software (Version 7.06, Platte River Associates). The depth data of the top and bottom of all formations were revealed by well Y172, and some measured borehole temperature and vitrinite reflectance (Ro) data were used to calibrate the modeling results. The Ro measurement was described by Stach et al. (1982). The basin modeling was conducted through integrating data such as stratigraphic data, lithology, absolute ages, erosion thickness, borehole temperatures, and maturity data (Table 1). All the data involved were collected from the Shengli Oilfield Research Institute, Sinopec. The modeled results were verified by measured borehole temperature and Ro data.
Relevant data sets of Es3 sandstone reservoirs in the Bonan oil field were collected from the Geological Shengli Oilfield Research Institute, Sinopec, including petrophysical property, oil saturation, carbonate content, and framework grain composition. More than 3000 reservoir properties data of the Es3 sandstones, including porosity and permeability, were collected to determine the reservoir quality, as well as their relationship with oil saturation. A helium porosimeter was used to measure core-plug porosity. The modified pressure transient method was applied to measure the sandstone permeability in a gas autoclave with nitrogen as the permeating medium. The carbonate content was measured by the hydrochloric acid-dissolution method and calculated from the content of carbon dioxide generated from the hydrochloric acid reaction. Framework grain composition data of 744 samples from 87 boreholes in the Bonan oil field were obtained from thin-section petrographic observation and used to determine the sandstone type in the Es3 sandstone reservoirs.
RESULTS
Petrographic Characteristics
The lithology of the Es3 sandstone reservoirs in the Bonan oil field is characterized by fine sandstone (130–360 μm) and pebbly sandstone with medium to coarse grain size. Detrital grain composition data of 744 samples suggest that the framework grains mainly contain quartz, feldspar, and lithic fragment (Figure 3). Detrital quartz is the most common framework grain with fraction from 20% to 68%, which is dominated by monocrystalline quartz (Figure 3). Feldspar accounts for 8% to 45% of the total framework grains, in which plagioclase and potassium feldspar constitute 1%–35% and 5%–40%, respectively (Figure 3). Lithic fragment accounts for 5% to 60% and is dominated by metamorphic and volcanic detritus with trace amounts of detrital carbonate (Figure 3). The sandstones of the Es3 interval in the Bonan oil field are mainly classified as lithic arkose and feldspathic litharenite with minor amount of arkose and litharenite (Figure 3). The lithic arkose and feldspathic litharenite account for 58.8% and 25.7% of the total sandstone samples, respectively. The amount of arkose and litharenite accounts for 16.5% of the total sandstone samples.
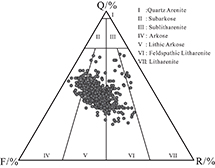 Figure 3.
The lithology classification of the third interval of the Paleogene Shahejie sandstone reservoirs in the Bonan oil field using the sandstone classification scheme of Folk et al. (1970). F = feldspar; Q = quartz; R = lithic fragment.
Figure 3.
The lithology classification of the third interval of the Paleogene Shahejie sandstone reservoirs in the Bonan oil field using the sandstone classification scheme of Folk et al. (1970). F = feldspar; Q = quartz; R = lithic fragment.
The main interstitial materials in the Es3 sandstone reservoirs are carbonate cement and clay. The average quartz cement was less than 3%. Carbonate cements are the most abundant cement, ranging from 0% to 27.8%. The content of clay ranges from 0.74% to 15.5%. The Es3 sandstone reservoirs have low compositional maturity with compositional maturity index (quartz/(feldspar + lithic fragment)) in the range of 0.14 to 2.73. The detrital grains display subrounded to angular shape and are moderately or poorly sorted, with Trask sorting coefficients ranging from 1.36 to 2.53.
Reservoir Porosity and Permeability
The Es3 sandstone reservoirs in the Bonan oil field have burial depths ranging mainly from 2600 to 4000 m (8530.2 to 13,123.4 ft) (Figure 4A, B). Both porosity and permeability decrease with increasing burial depth. The maximum porosity of the Es3 sandstone reservoirs decreases from approximately 30% to 15%, with burial depth increasing from 2600 to 4000 m (8530.2 to 13,123.4 ft) (Figure 4A). Most of the sandstone reservoirs have porosity in the range of 5% to 25%, comprising 90.9% of the total samples (Figure 4C). Permeability of the Es3 sandstone reservoirs is mostly in the range of <500 md, accounting for 96% of the total samples (Figure 4D).
 Figure 4.
(A, B) Porosity–depth and permeability–depth plots of the third interval of the Paleogene Shahejie (Es3) sandstone reservoirs in the Bonan oil field. (C, D) Porosity and permeability distribution histogram of the Es3 sandstone reservoirs in the Bonan oil field.
Figure 4.
(A, B) Porosity–depth and permeability–depth plots of the third interval of the Paleogene Shahejie (Es3) sandstone reservoirs in the Bonan oil field. (C, D) Porosity and permeability distribution histogram of the Es3 sandstone reservoirs in the Bonan oil field.
The pore space of the Es3 sandstone reservoirs in the Bonan oil field is dominated by primary pores with a minor number of secondary dissolution pores and grain fractures (Figure 5). Bitumen can be observed in some samples. Primary pores constitute most of the pore space, with visual porosity up to 14% (Figure 5A, B). Most of the primary pores observed in the samples have been modified and expanded by latter dissolution to form hybrid pores (Figure 5A). The dissolution-generated porosity occurred on the edges and also was observed inside the grains in cases where grain fractures were present. Secondary pores were mainly formed by feldspar and lithic fragment dissolution (Figure 5A, C, D). Minor dissolution of quartz grains and carbonate cements was also observed (Figure 5A, C). Fractures on rigid grains including quartz and feldspar were developed (Figure 5D). Dissolution is also observed to have developed along fractures (Figure 5D).
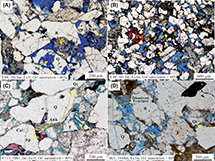 Figure 5.
Typical pore types and dissolution in the sandstone reservoirs of the third interval of the Paleogene Shahejie (Es3) in the Bonan oil field. (A) Intragranular pores formed by the dissolution of quartz (Q) and lithic fragment (R) and the development of kaolinite (Kao; plane-polarized light). (B) Dissolved grains surrounded by bitumen and mold pore caused by the dissolution of feldspar (F; plane-polarized light). (C) Intragranular pores due to the dissolution of F and calcite (Cal) and development of quartz overgrowth (Qc; plane-polarized light). (D) Dissolution along fractures in grains, dissolved F and R, and the dissolution of Qc (plane-polarized light). Ank = ankerite; Es3l = lower part of Es3; Es3m = middle part of Es3; Es3u = upper part of Es3; M = clay; Pp = primary pore; Sp = secondary pore.
Figure 5.
Typical pore types and dissolution in the sandstone reservoirs of the third interval of the Paleogene Shahejie (Es3) in the Bonan oil field. (A) Intragranular pores formed by the dissolution of quartz (Q) and lithic fragment (R) and the development of kaolinite (Kao; plane-polarized light). (B) Dissolved grains surrounded by bitumen and mold pore caused by the dissolution of feldspar (F; plane-polarized light). (C) Intragranular pores due to the dissolution of F and calcite (Cal) and development of quartz overgrowth (Qc; plane-polarized light). (D) Dissolution along fractures in grains, dissolved F and R, and the dissolution of Qc (plane-polarized light). Ank = ankerite; Es3l = lower part of Es3; Es3m = middle part of Es3; Es3u = upper part of Es3; M = clay; Pp = primary pore; Sp = secondary pore.
Major Diagenetic Processes
Mechanical Compaction
The Es3 sandstone reservoirs in the Bonan oil field experienced strong mechanical compaction, which is evidenced by nested grain fabrics, compacted clay in pore space, and cutting-through fracturing in rigid grains. Line contacts among framework grains were observed in the Es3 sandstone reservoirs (Figures 6B, 7F). The clay in the sandstone was filled in the pore space (Figure 6A). Rigid grains, such as quartz and feldspar, were observed to develop cutting-through fractures under the force of overlying sediments (Figure 5D). Sandstones with different clay content present various features of mechanical compaction. Clay-rich sandstones experienced stronger mechanical compaction, with the pore space fully filled by compacted clay (Figure 6A). Clay-rich sandstones rarely developed line contact and fractures because of the cushion from clay. Fractures were mainly observed in clay-poor sandstones. Pore spaces in clay-poor samples were preserved.
 Figure 6.
Typical compaction and quartz (Q) cementation in the third interval of the Paleogene Shahejie (Es3) sandstone reservoirs in the Bonan oil field. (A) Dissolved quartz grain surrounded by compacted clay (M) and mechanical compaction in clay-rich samples (orthogonal-polarized light). (B) Quartz overgrowth (Qc) constrained by calcite II (plane-polarized light). (C) Qc constrained by ankerite (Ank; orthogonal-polarized light). (D) Dissolved Qc (plane-polarized light). Cal II = second-phase calcite; Es3l = lower part of Es3; Es3m = middle part of Es3; Es3u = upper part of Es3; F = feldspar; R = lithic fragment.
Figure 6.
Typical compaction and quartz (Q) cementation in the third interval of the Paleogene Shahejie (Es3) sandstone reservoirs in the Bonan oil field. (A) Dissolved quartz grain surrounded by compacted clay (M) and mechanical compaction in clay-rich samples (orthogonal-polarized light). (B) Quartz overgrowth (Qc) constrained by calcite II (plane-polarized light). (C) Qc constrained by ankerite (Ank; orthogonal-polarized light). (D) Dissolved Qc (plane-polarized light). Cal II = second-phase calcite; Es3l = lower part of Es3; Es3m = middle part of Es3; Es3u = upper part of Es3; F = feldspar; R = lithic fragment.
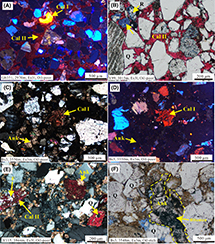 Figure 7.
Typical carbonate cementation in the third interval of the Paleogene Shahejie (Es3) sandstone reservoirs of the Bonan oil field. (A) Blocky calciteI (yellow color) and poikilotopic calcite II (dark red color) cementation (cathodoluminescence). (B) Pervasive poikilotopic calcite II cementation, quartz (Q) grain corroded by calcite II and mold pore (plane-polarized light). (C) Blocky calciteI (red color) surrounded by blocky ankerite (Ank; orthogonal-polarized light). (D) The same image zone as (C), blocky calciteI (red color) surrounded by blocky Ank (nonluminescent) (CL). (E) Blocky calcite II surrounded or emplaced by blocky Ank; dissolved feldspar (F) replaced by calcite II (orthogonal-polarized light). (F) Ank crystal stained by bitumen (plane-polarized light). Cal I = first-phase calcite; Cal II = second-phase calcite; Es3l = lower part of Es3; Es3m = middle part of Es3; Es3u = upper part of Es3; Qc = quartz overgrowth; R = lithic fragment.
Figure 7.
Typical carbonate cementation in the third interval of the Paleogene Shahejie (Es3) sandstone reservoirs of the Bonan oil field. (A) Blocky calciteI (yellow color) and poikilotopic calcite II (dark red color) cementation (cathodoluminescence). (B) Pervasive poikilotopic calcite II cementation, quartz (Q) grain corroded by calcite II and mold pore (plane-polarized light). (C) Blocky calciteI (red color) surrounded by blocky ankerite (Ank; orthogonal-polarized light). (D) The same image zone as (C), blocky calciteI (red color) surrounded by blocky Ank (nonluminescent) (CL). (E) Blocky calcite II surrounded or emplaced by blocky Ank; dissolved feldspar (F) replaced by calcite II (orthogonal-polarized light). (F) Ank crystal stained by bitumen (plane-polarized light). Cal I = first-phase calcite; Cal II = second-phase calcite; Es3l = lower part of Es3; Es3m = middle part of Es3; Es3u = upper part of Es3; Qc = quartz overgrowth; R = lithic fragment.
Quartz Cement
Only one phase of authigenic quartz was observed in the Es3 sandstone reservoirs, primarily existing as quartz overgrowth (Figure 6B–D). Syntaxial quartz overgrowth developed around detrital quartz gains with a thickness from 13 to 33 μm. Some quartz overgrowth precipitated along dissolved quartz grains, and some quartz overgrowth was also subject to dissolution along the edge (Figure 6D). The development of quartz overgrowths was constrained or replaced by calcite (Figure 6B) and ankerite cements (Figure 6C). Quartz overgrowth is relatively low in abundance overall, with visual content from 0.06% to 3.6% in the Es3 sandstone reservoirs.
Carbonate Cement
Carbonate cements constitute the main cementation in the Es3 sandstone reservoirs in the Bonan oil field, primarily including calcite and ankerite based on thin-section observation, XRD, and EDS analysis (Figures 7, 8). Calcite cements are stained red in thin sections (Figure 7B). The compositions of calcite from EDS indicates that the calcite yields the Fe content from 0.7 to 2.2 wt. %, Mg content from 0 to 0.6 wt. %, and Ca content from 31.9 to 36.8 wt. % (Figure 8D). The CL examination combined with EDS revealed two types of calcite cements in the Es3 sandstone reservoirs. Calcite I presents red or yellow color under CL with low Fe content of <1.2 wt. %, which developed rarely in the Es3 sandstone reservoirs with visual content from 0.1% to 7% (Figure 7A). Calcite II displays dark red color under CL with higher Fe content of 1.7 to 2.2 wt. %, which dominates the calcite cementation with visual content from 0.3% to 27.2% (Figure 7A, B). Calcite II has higher Fe/Mn values than that of the calcite I (Figure 8B). The calcite cements in the Es3 sandstone reservoirs mostly exist as poikilotopic crystal. The detrital grains either float or have point contact on continuous poikilotopic calcite II in pervasively cemented sandstone (Figure 7B). Discrete blocky calcite crystals were also observed when calcite I was surrounded by calcite II or ankerite (Figure 7A, C). Quartz grains are observed to be engulfed by calcite II (Figure 7B). Moldic pores developed when some minerals surrounded by calcite II were totally dissolved (Figure 7B). Calcite II also developed around the remnants of dissolved feldspar (Figure 7E).
 Figure 8.
(A) Scanning electron microscopy images show the location of energy-dispersive spectrometer (EDS) test spots and the line location of the EDS line composition test on carbonate cements. (B) Plots of Fe/Mn values and Ca content showing the difference of the calcite I, calcite II, and ankerite (Ank) compositions. (C) The result of line composition test reveals the Cal II surrounded by Ank. The line location is labeled in (A). (D) The EDS images reveal the development of Cal I, Cal II, and Ank, and the test spots are labeled in (A). Cal-I = first-phase calcite; Cal-II = second-phase calcite.
Figure 8.
(A) Scanning electron microscopy images show the location of energy-dispersive spectrometer (EDS) test spots and the line location of the EDS line composition test on carbonate cements. (B) Plots of Fe/Mn values and Ca content showing the difference of the calcite I, calcite II, and ankerite (Ank) compositions. (C) The result of line composition test reveals the Cal II surrounded by Ank. The line location is labeled in (A). (D) The EDS images reveal the development of Cal I, Cal II, and Ank, and the test spots are labeled in (A). Cal-I = first-phase calcite; Cal-II = second-phase calcite.
The ankerite cements in the Es3 sandstone reservoirs have visual content ranging from 0.14% to 27.8%. Ankerite cements have Fe content in the range of 4.4 to 9.4 wt. %, Mg content in the range of 3.3 to 8.1 wt. %, and Ca content in the range of 18.6 to 23.7 wt. %, respectively (Figure 8D), which display higher Fe/Mn values and lower Ca content than that of the calcite cements (Figure 8B). Ankerite is unstained in thin sections (Figure 7C, E, F) and nonluminescent under CL examination (Figure 7D). Ankerite mainly exhibits as pore-filling blocky anhedral crystal morphology (Figure 7C). Rhombohedral ankerite crystal in places developed in pores (Figure 7E). Ankerite was observed to surround or emplace calcite II (Figures 7E, 8C). Pore-filling ankerite crystal was observed to be stained by black bitumen (Figure 7F).
Mineral Dissolution
Two types of mineral dissolution were observed in the Es3 sandstone reservoirs of the Bonan oil field, (1) dissolution of quartz grains and (2) dissolution of feldspar grains and carbonate cements. Quartz grains were mainly dissolved along the grain edge, displaying a harbor-like shape (Figure 6A). It was observed that quartz grains were locally dissolved inside to develop intragranular pores (Figure 5A). Some dissolved quartz grains are surrounded by compacted clay (Figure 6A). Acidic dissolution mainly occurred on feldspar grains both along the grain edge and within the grain, which occurred as harbor-like or honeycomb-like shapes and formed intergranular or intragranular pores (Figure 5C, D). Some feldspars were totally dissolved, forming moldic pores (Figure 5B). Some secondary pores formed by feldspar dissolution are filled with booklet kaolinite (Figure 5A). In cases where minor calcite cement dissolution was observed, the dissolution typically occurred along the grain edge, causing the generation of secondary pores (Figure 5C). Dissolution of ankerite was not observed. The dissolved quartz and feldspar grains were observed to be enclosed by bitumen, with bitumen coating mold pore (Figure 5B). Dissolution also occurred along the fractures in the quartz and feldspar grains (Figure 5D).
Fluid Inclusions
Abundant fluid inclusions were observed within detrital quartz and carbonate cements in the Es3 sandstone reservoirs of the Bonan oil field, including oil inclusions, oil-associated aqueous inclusions, and primary aqueous inclusions in carbonate cements, which were identified by plane-polarized light and cross-polarized light observation combined with XRD data (Figure 9).
 Figure 9.
Microscopic characteristics of fluid inclusions in the third interval of the Paleogene Shahejie (Es3) sandstone reservoirs of the Bonan oil field. (A) Oil inclusion in quartz (Q) healed fracture (plane-polarized light). (B) The same image zone as (A), showing oil inclusion in Q healed fracture with blue-white fluorescing under ultraviolet light. (C) Aqueous inclusion in the calclite II cement (Cal II) (plane-polarized light). (D) Aqueous inclusion in ankerite (Ank) cement (plane-polarized light). Cal II = second-phase calcite cement.
Figure 9.
Microscopic characteristics of fluid inclusions in the third interval of the Paleogene Shahejie (Es3) sandstone reservoirs of the Bonan oil field. (A) Oil inclusion in quartz (Q) healed fracture (plane-polarized light). (B) The same image zone as (A), showing oil inclusion in Q healed fracture with blue-white fluorescing under ultraviolet light. (C) Aqueous inclusion in the calclite II cement (Cal II) (plane-polarized light). (D) Aqueous inclusion in ankerite (Ank) cement (plane-polarized light). Cal II = second-phase calcite cement.
Oil inclusions and associated aqueous inclusions were observed in healed fractures of detrital quartz grains (Figure 9A, B). No oil inclusions were found in carbonate cements. The oil inclusions have diameters of 5 to 22.9 μm, whereas the diameter of oil-associated aqueous inclusion ranges from 5 to 18.1 μm (Table 2). The oil inclusions present a fluorescence color of blue-white (Figure 9B). The Th values of oil inclusions are in the ranges of 95°C to 100°C and 110°C to 115°C (Figure 10). Aqueous inclusions along the same fractures as the oil inclusions yield corresponding Th values in the range of 120°C to 135°C and 130°C to 150°C (Figure 10).

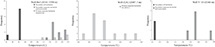 Figure 10.
Homogenization temperature histogram of oil inclusions, aqueous inclusions coeval with oil inclusions in detrital quartz grains, and aqueous inclusions in carbonate cements from three typical wells (Bs3, Z242, and Y110) in the third interval of the Paleogene Shahejie sandstone reservoirs of the Bonan oil field.
Figure 10.
Homogenization temperature histogram of oil inclusions, aqueous inclusions coeval with oil inclusions in detrital quartz grains, and aqueous inclusions in carbonate cements from three typical wells (Bs3, Z242, and Y110) in the third interval of the Paleogene Shahejie sandstone reservoirs of the Bonan oil field.
Primary aqueous inclusions with diameters of 5 to 7.5 μm were identified in calcite II and ankerite cements in the Es3 sandstone reservoirs (Figure 9C, D; Table 2). The Th of the aqueous inclusions in calcite II cements range from 100°C to 130°C (Figure 10), whereas that in ankerite cements ranges from 120°C to 135°C (Figure 10).
Oxygen Stable Isotope Compositions
In the Es3 sandstone reservoirs of the Bonan oil field, the calcite II cements in sandstones have δ18O values from −16.31‰ to −11.48‰, and the ankerite cements of sandstones have δ18O values from −12.91‰ to −12.38‰ (Table 3). The calculated precipitation temperatures are 80.5°C–128.3°C for calcite II and 125°C–129.6°C for ankerite cements in the Es3 sandstone reservoirs (Table 3).

Basin Modeling
Basin modeling results of well Y172 show excellent correlation between the observed and calculated data of Ro and borehole temperature, indicating reasonable maturity and thermal modeling (Figure 11B). Burial history modeling indicates that the Es3 interval of the Bonan oil field experienced a rapid subsidence from 42 to 24.6 Ma, during which the source rocks in the Es3l entered the oil-generation threshold at a depth of approximately 2000 m (6561.7 ft), with a temperature of 90°C and maturity of 0.5% Ro (Figure 11A). During 24.6 to 16 Ma, the maturity of source rocks had reached 0.7% Ro at a depth of 3000 m (9842.5 ft), with a temperature of 120°C circa 5 Ma (Figure 11A). With continuous subsidence, the source rocks in the lower Es3 (Es3l) have remained in the mature oil window of 0.7% to 1.0% Ro up to 4000 m (13,123.4 ft) burial depth until present day (Figure 11A).
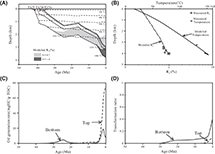 Figure 11.
Basin modeling results of the well Y172 in the Bonan oil field. (A) Burial history modeling. (B) Depth profiles of correlation between modeled and measured data (temperature and reflectance). (C) Evolution of oil-generation rate of source rocks in the lower interval of the third interval of the Paleogene Shahejie (Es3l). (D) Transformation ratio evolution of source rocks in the Es3l. Es3m = middle part of Es3; Es3u = upper part of Es3; Ro = vitrinite reflectance; TOC = total organic carbon content.
Figure 11.
Basin modeling results of the well Y172 in the Bonan oil field. (A) Burial history modeling. (B) Depth profiles of correlation between modeled and measured data (temperature and reflectance). (C) Evolution of oil-generation rate of source rocks in the lower interval of the third interval of the Paleogene Shahejie (Es3l). (D) Transformation ratio evolution of source rocks in the Es3l. Es3m = middle part of Es3; Es3u = upper part of Es3; Ro = vitrinite reflectance; TOC = total organic carbon content.
Oil-generation modeling, including the transformation ratio and oil-generation rate per unit weight of source rocks versus time, indicated that there was mainly one episode of oil generation in the source rocks of the Es3l (Figure 11C, D). In the Es3l, source rocks at the bottom began to generate oil from 30 Ma with a transformation ratio less than 10% and oil-generation rate less than 10 mg/g·total organic carbon content (TOC). The source rocks in the Es3l reached their peak of oil generation after 5 Ma with a transformation ratio up to 40% and oil-generation rate up to 80 mg/g·TOC (Figure 11C, D).
DISCUSSION
Factors Controlling Reservoir Quality
The Es3 sandstone reservoirs in the Bonan oil field were subjected to significant compaction and cementation, with CoPL ranging from 3.3% to 26.6% and CePL ranging from 0.1% to 28.3%. The sandstone samples with high CoPL and CePL values have high clay content and carbonate cements content, respectively. The pressure dissolution is rare in the Es3 sandstone reservoirs due to most of the grains of sandstone in point and line contact, corroborating the reliability of the calculated CoPL and CePL (Ehrenberg, 1989). Because the cements in the sandstone reservoirs are dominated by carbonate cements, the CePL is attributed to carbonate cementation in this study.
Sedimentary factors, such as depositional composition and texture, critically control the sandstone reservoir quality (Bjørlykke, 2015). In the Es3 sandstone reservoirs, the grain size and sorting of sandstone display poor correlation with the porosity (Figure 12A, B). The effect of sedimentation on porosity development was principally determined by clay content. With clay content increasing to 15%, the sandstone reservoir porosity declines to less than 2% (Figure 12C). Clay-poor sandstones (clay content <7%) with low porosity are due to pervasive carbonate cementation (Figure 12C). Sandstones rich in clay were incapable of retarding mechanical compaction (Rossi and Alaminos, 2014; K.-L. Xi et al., 2015; Yang et al., 2020). The clay-rich sandstones also display rare carbonate cements because there was little primary porosity preserved that could be accessed by pore fluids to precipitate calcite (Yang et al., 2014; K. Xi et al., 2015) (Figure 12E).
 Figure 12.
Various crossplots of the third interval of the Paleogene Shahejie sandstone reservoirs in the Bonan oil field. (A) Crossplot of average grain size versus porosity. (B) Crossplot of Trask sorting index versus porosity. (C) Crossplot of clay content versus porosity. (D) Crossplot of clay content versus porosity loss from compaction (CoPL). (E) Crossplot of clay content versus carbonate cements content. (F) Crossplot of intergranular volume versus cement volume. (G) Crossplot of CoPL versus porosity. (H) Crossplot of porosity loss from cementation (CePL) versus porosity. (I) Crossplot of primary/secondary porosity versus total porosity. All the data in this figure are from point-counting analysis in petrographic observation. cc = carbonate content; IGV = intergranular volume.
Figure 12.
Various crossplots of the third interval of the Paleogene Shahejie sandstone reservoirs in the Bonan oil field. (A) Crossplot of average grain size versus porosity. (B) Crossplot of Trask sorting index versus porosity. (C) Crossplot of clay content versus porosity. (D) Crossplot of clay content versus porosity loss from compaction (CoPL). (E) Crossplot of clay content versus carbonate cements content. (F) Crossplot of intergranular volume versus cement volume. (G) Crossplot of CoPL versus porosity. (H) Crossplot of porosity loss from cementation (CePL) versus porosity. (I) Crossplot of primary/secondary porosity versus total porosity. All the data in this figure are from point-counting analysis in petrographic observation. cc = carbonate content; IGV = intergranular volume.
In the Es3 sandstone reservoirs, the CoPL is higher than that caused by cementation. The scatterplot of cement content versus IGV also suggests that the loss of primary porosity was mostly caused by mechanical compaction, and only seven samples show the loss of primary porosity owing to carbonate cementation (Figure 12F). However, the porosity of the Es3 sandstone reservoirs shows no correlation with CoPL but correlates negatively with CePL (Figure 12G, H). The CePL due to carbonate cementation displays a negative correlation with porosity of the clay-poor samples (Figure 12H). Analyses indicate that carbonate cements in the Es3 sandstone reservoirs are dominated by calcite II and ankerite. Therefore, the cementation of calcite II and ankerite is attributed to the lower porosity of clay-poor sandstone reservoirs in the Es3 interval. The existence of carbonate cements that predate significant compaction can effectively retard mechanical compaction of reservoirs (Zhang et al., 2010). The carbonate cement content has a positive correlation with IGV in the sandstone reservoirs of the Es3 interval (Figure 12F). Moderate development of carbonate cements can lead to the preservation of primary pores and is also favorable for the influx of the latter pore fluid to cause the formation of secondary pores (Figure 5C). The pore space in the Es3 sandstone reservoirs in the Bonan oil field is dominated by primary pores with minor contribution from secondary pores (Figure 12I). Secondary pores generated from dissolution are commonly occupied by calcite II and ankerite (Figure 7B, E). Therefore, mineral dissolution exerted some limited influence, with increasing porosity less than 8% on the reservoir quality of the Es3 interval. The porosity preservation of the Es3 interval depends mainly on the preservation of primary pores from mechanical compaction and carbonate cementation.
Diagenetic Sequence
The diagenetic sequence of the Es3 sandstone reservoirs in the Bonan oil field can be divided into eogenetic and mesogenetic stages (Figure 13). The eogenetic stage occurred after deposition and terminated with the completion of mechanical compaction (Morad et al., 2010; Worden et al., 2018). In the Es3 sandstone reservoirs, the eogenetic stage is characterized by temperature of <80°C and depth of <1500 m (4921.3 ft) (Figure 13). This stage was dominated by mechanical compaction (Figure 13). The first-phase quartz dissolution was synchronous with mechanical compaction because the dissolved quartz grains were surrounded by compacted clay (Figure 6A). The alkaline fluid was suggested to occur at the beginning of the Es3 interval deposition (Ma et al., 2015b; Han et al., 2021). Calcite I with low Fe content less than 1% (Figure 8), which was surrounded by Fe-rich calcite II or ankerite, is considered to have precipitated in the eogenetic stage (Figure 13).
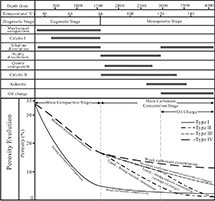 Figure 13.
Diagenetic sequence and porosity evolution of the third interval of the Paleogene Shahejie sandstone reservoirs in the Bonan oil field. The original porosity (Ope) is equal to the average calculated Ope of all the sandstone samples. The porosity loss in the main compaction stage is equal to the sum of clay content and calculated porosity loss from compaction. The porosity loss in the main carbonate cementation stage is equal to the calculated porosity loss from cementation minus the secondary porosity. All the data are in Table 3.
Figure 13.
Diagenetic sequence and porosity evolution of the third interval of the Paleogene Shahejie sandstone reservoirs in the Bonan oil field. The original porosity (Ope) is equal to the average calculated Ope of all the sandstone samples. The porosity loss in the main compaction stage is equal to the sum of clay content and calculated porosity loss from compaction. The porosity loss in the main carbonate cementation stage is equal to the calculated porosity loss from cementation minus the secondary porosity. All the data are in Table 3.
The mesogenetic stage of the Es3 sandstone reservoirs occurred with depth of >1500 m (4921.3 ft) and temperature of >80°C (Figure 13). When the temperature reached 75°C–90°C, kerogen degradation in source rocks began to release short-chain carboxylic acids and CO2 before oil generation, and the maximum temperature for organic acid preservation is 80°C–120°C (Schmidt and McDonald, 1979; Surdam et al., 1989). In the early mesogenetic stage, we conclude that acidic liquid from kerogen degradation migrated into the reservoirs from the source rocks, leading to the acidification of the diagenetic fluid in reservoirs of the Es3 interval (Han et al., 2021). It is speculated that the acidic dissolution on feldspar grains mainly occurred in this stage, resulting in the release of SiO2 and the formation of kaolinite (Figure 13). Smectite also began to transform into illite and released Fe2+, Mg2+, and aqueous SiO2 into pore fluid in the early mesogenetic stage with temperature greater than 70°C–90°C (Hower et al., 1976; Boles and Franks, 1979). With aqueous SiO2 released from feldspar dissolution and clay mineral transformation, quartz overgrowths occurred along quartz grains (Figure 13). According to the oxygen isotope analysis and Th from aqueous inclusions in the calcite II minerals, the precipitation temperature of calcite II was from 80°C to 130°C (Figure 13). Combined with burial and thermal histories, the precipitation of calcite II is inferred to have begun circa 15 Ma (Figure 11A). Calcite II was observed to surround the dissolved feldspar and quartz overgrowth, indicating that the main calcite II precipitation postdates the acidic dissolution and quartz cementation (Figure 13).
During the late mesogenetic stage, ankerite cementation developed, which postdates the calcite II cementation because calcite II was replaced by ankerite (Figure 7E). The precipitation temperature of ankerite began at 120°C, according to oxygen-stable isotope and fluid inclusion data (Figure 13). The time of ankerite precipitation was post-5 Ma, based on burial and thermal histories (Figure 11A). The second phase of alkaline dissolution of quartz and quartz overgrowth occurred in the late mesogenetic stage, presumably due to decarboxylation of organic acids once temperature reached >120°C (Surdam et al., 1989) (Figure 13). The sandstone reservoirs of the Es3 interval received the main phase of oil emplacement mainly in the late mesogenetic stage when the reservoirs’ temperature reached 120°C–150°C based on the Th of oil-associated aqueous inclusions and oil-generation history (Figure 13). Combined with burial, thermal, and oil-generation histories, the oil emplacement is inferred to have occurred post-5 Ma (Figure 11A). This result is consistent with previous studies showing that there was one phase of oil emplacement in the sandstone reservoirs of the Es3 interval after the Neocene Minghuazhen Formation (5 Ma) in the Bonan sag (Liu et al., 2016; Han et al., 2020).
Influence of Oil Emplacement on Reservoir Quality
In the Es3 sandstone reservoirs of the Bonan oil field, oil emplacement was observed during petrographic analysis with residual bitumen in pore space and oil inclusion in fractures of quartz grains (Figures 5B, 9B). To investigate the relationship among oil emplacement, carbonate cementation, and porosity evolution, sandstones from the Es3 reservoirs were subdivided into two groups, oil-rich samples and oil-poor samples, according to oil-saturation evaluation. The oil-rich samples have oil saturation of >40%, and the oil-poor samples have oil saturation of <40% (Figure 14A).
 Figure 14.
Core photo and photomicrograph of sandstone samples showing the lithological features of sandstone with different oil saturation. (A) The sandstone with low oil saturation surrounded by sandstone with high oil saturation, well Y99, 3015.7 m (9894 ft). (B) The sandstone with low oil saturation is tightened by type II calcite cementation, well Y99, 3015.7 m (9894 ft). (C) The sandstone with high oil saturation presents little carbonate cementation and high porosity, well Y99, 3016.5 m (9896.7 ft). Es3l = lower part of the third interval of the Paleogene Shahejie.
Figure 14.
Core photo and photomicrograph of sandstone samples showing the lithological features of sandstone with different oil saturation. (A) The sandstone with low oil saturation surrounded by sandstone with high oil saturation, well Y99, 3015.7 m (9894 ft). (B) The sandstone with low oil saturation is tightened by type II calcite cementation, well Y99, 3015.7 m (9894 ft). (C) The sandstone with high oil saturation presents little carbonate cementation and high porosity, well Y99, 3016.5 m (9896.7 ft). Es3l = lower part of the third interval of the Paleogene Shahejie.
In the Es3 sandstone reservoirs, sandstones with oil saturation of >40% and oil saturation of <40% have different petrophysical property and carbonate contents (Figure 15). The sandstones with oil saturation of >40% have an average porosity of 18.3%, with most of the sandstones falling in the porosity range of 10% to 25% (Figure 15A). The sandstones with porosity of >25% are mainly samples with oil saturation of >40% (Figure 15A). The permeability of sandstone with oil saturation of >40% is mainly higher than 1 md. The sandstones with permeability of >500 md are dominated by samples with oil saturation of >40% (Figure 15B). The sandstones with oil saturation of <40% are characterized by relatively low porosity, from 5% to 20%, with an average porosity of 13.5% (Figure 15A). The sandstones with porosity of <10% are mostly samples with oil saturation of <40% (Figure 15A). Most of the sandstones with oil saturation of <40% have permeability of <100 md (Figure 15B). The sandstones with permeability of <1 md are principally samples with oil saturation of <40% (Figure 15B). The sandstones with oil saturation of >40% have little carbonate content, with an average carbonate content of 5.7%, whereas the average carbonate content of sandstones with oil saturation of <40% is 8.9% (Figure 15C). The difference in carbonate contents for the sandstones with different oil saturation is most pronounced among the sandstones with carbonate contents of >20% (Figure 15C). Approximately 20% of the sandstones with oil saturation of <40% contain carbonate >20%, whereas only approximately 4% of the sandstones with oil saturation of >40% have carbonate content of >20% (Figure 15C). All the sandstones which were pervasively cemented with carbonate content of >25% exhibit low oil saturation (Figure 15C).
 Figure 15.
Distribution histogram of petrophysical property and carbonate content of the sandstones with different oil saturation from the third interval of the Paleogene Shahejie sandstone reservoirs in the Bonan oil field. (A) Distribution histogram of porosity of sandstones with different oil saturation. (B) Distribution histogram of permeability of sandstones with different oil saturation. (C) Distribution histogram of carbonate content of sandstones with different oil saturation.
Figure 15.
Distribution histogram of petrophysical property and carbonate content of the sandstones with different oil saturation from the third interval of the Paleogene Shahejie sandstone reservoirs in the Bonan oil field. (A) Distribution histogram of porosity of sandstones with different oil saturation. (B) Distribution histogram of permeability of sandstones with different oil saturation. (C) Distribution histogram of carbonate content of sandstones with different oil saturation.
The influence of oil emplacement on reservoir quality can be illustrated by the difference in petrophysical property in well Y282. The Es3 sandstone reservoirs from well Y282 are dominated by pebbly sandstone intercalated with thin layers of fine sandstone, argillaceous sandstone, calcareous sandstone, and mudstone (Figure 16). Petrophysical property data from pebble sandstone were selected in this study to eliminate the influence of sedimentary factors on petrophysical property. The pebbly sandstone layers from well Y282 contain two sets of oil-rich layers with oil saturation ranging from 41.3% to 55.8%, which are accompanied by a set of oil-poor layers with oil saturation of 13.6% to 35.3% at the bottom (Figure 16). The oil-rich layer and oil-poor layer are within 10 m (32.8 ft) of each other, so the porosity difference due to mechanical compaction is negligible. Two oil-rich layers in the well Y282 present higher porosity and lower carbonate content than the adjacent oil-poor layers. The top sandstones with oil saturation of >40% have an average porosity of 12.2% and an average carbonate content of 14.9% (Figure 16). The adjacent sandstones with oil saturation of <40% have an average porosity of 6.2% and an average carbonate content of 25.6%. The bottom sandstones with oil saturation of >40% have an average porosity of 12.2% and an average carbonate content of 11.7% (Figure 16). The adjacent sandstones with oil saturation of <40% have an average porosity of 8.5% and an average carbonate content of 17.3% (Figure 16). In particular, the bottom samples with different oil saturation have relatively similar porosity and carbonate contents. With the oil preferentially accumulating in the top sandstone layer, carbonate cementation in the sandstones with oil saturation of >40% was retarded, leading to differential porosity and carbonate content in the sandstones with different oil saturation.
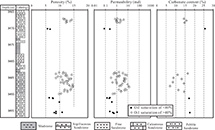 Figure 16.
Depth profiles of porosity, permeability, and carbonate content from a typical well, Y282, as well as the corresponding lithologic column, demonstrating the difference on porosity, permeability, and carbonate content of the sandstones with different oil saturation.
Figure 16.
Depth profiles of porosity, permeability, and carbonate content from a typical well, Y282, as well as the corresponding lithologic column, demonstrating the difference on porosity, permeability, and carbonate content of the sandstones with different oil saturation.
According to the diagenetic sequence, the oil emplacement postdated the calcite II cementation and was synchronous with ankerite cementation, based on the presence of bitumen with ankerite in the Es3 sandstone reservoirs of the Bonan oil field (Figure 13). Two circumstances are summarized about the relationships among oil emplacement, carbonate cementation, and porosity evolution in the Es3 sandstone reservoirs. If the sandstone reservoir with porosity is less than 10% with the calcite II cementation development before oil emplacement, the low permeability of the sandstone reservoir could retard the subsequent oil emplacement. For example, the sandstone at the depth of 3015.7 m (9894 ft) in the well Y99 presents concretionary calcite II cementation (Figure 14A, B). The sandstone with porosity of 6.2% due to the calcite II cementation retarded the subsequent oil emplacement and caused the sandstone with oil saturation of <40% surrounded by sandstone with oil saturation of >40% (Figure 14A). This also explains why the sandstones with carbonate content of >20% are mostly oil-poor in the Es3 interval. If the sandstone reservoirs preserved porosity from calcite cementation and received oil emplacement, the oil accumulated in the sandstone reservoirs could retard the subsequent carbonate cementation, especially the ankerite cementation. The sandstones with oil saturation of >40% at the depth of 3016.5 m (9896.7 ft) in the well Y99 display a low degree of calcite and ankerite cementation and high porosity up to 21.4%, although ankerite cementation can be identified in both oil-poor and oil-rich samples (Figure 7C, F). However, the content of ankerite cementation in oil-rich sample with the depth of 3548 m is only approximately 5%, which is lower than that of the oil-poor sample with the depth of 3550 m in well Bs3. In other words, the hydrocarbons are not inhibiting ankerite cementation totally, but rather, they are simply occupying space that is not occupied by ankerite cement. There is no direct evidence of ankerite cement inhibition. It is certainly possible that the observed correlation is simply a result of the fact that oil can more easily displace water in high-permeability reservoir rocks than low-permeability reservoir rocks. Therefore, the effect of oil emplacement on the reservoir quality depends on the oil charge timing. Both circumstances lead to the fact that the sandstone with oil saturation of >40% has better petrophysical property and little carbonate content compared with the sandstone with oil saturation of <40% in the Es3 sandstone reservoirs.
Reservoir Porosity Evolution Model
The Es3 sandstone reservoirs can be classified into four categories, according to the porosity evolution (Figure 13). The well logs of gamma ray and resistivity for the four types of sandstone reservoirs are shown in Figure 17.
 Figure 17.
Depth profiles of lithologic column and well logs for the sandstone reservoirs in the third interval of the Paleogene Shahejie interval in the Bonan oil field showing the difference of gamma ray and resistivity well logs for the four types of sandstone reservoirs.
Figure 17.
Depth profiles of lithologic column and well logs for the sandstone reservoirs in the third interval of the Paleogene Shahejie interval in the Bonan oil field showing the difference of gamma ray and resistivity well logs for the four types of sandstone reservoirs.
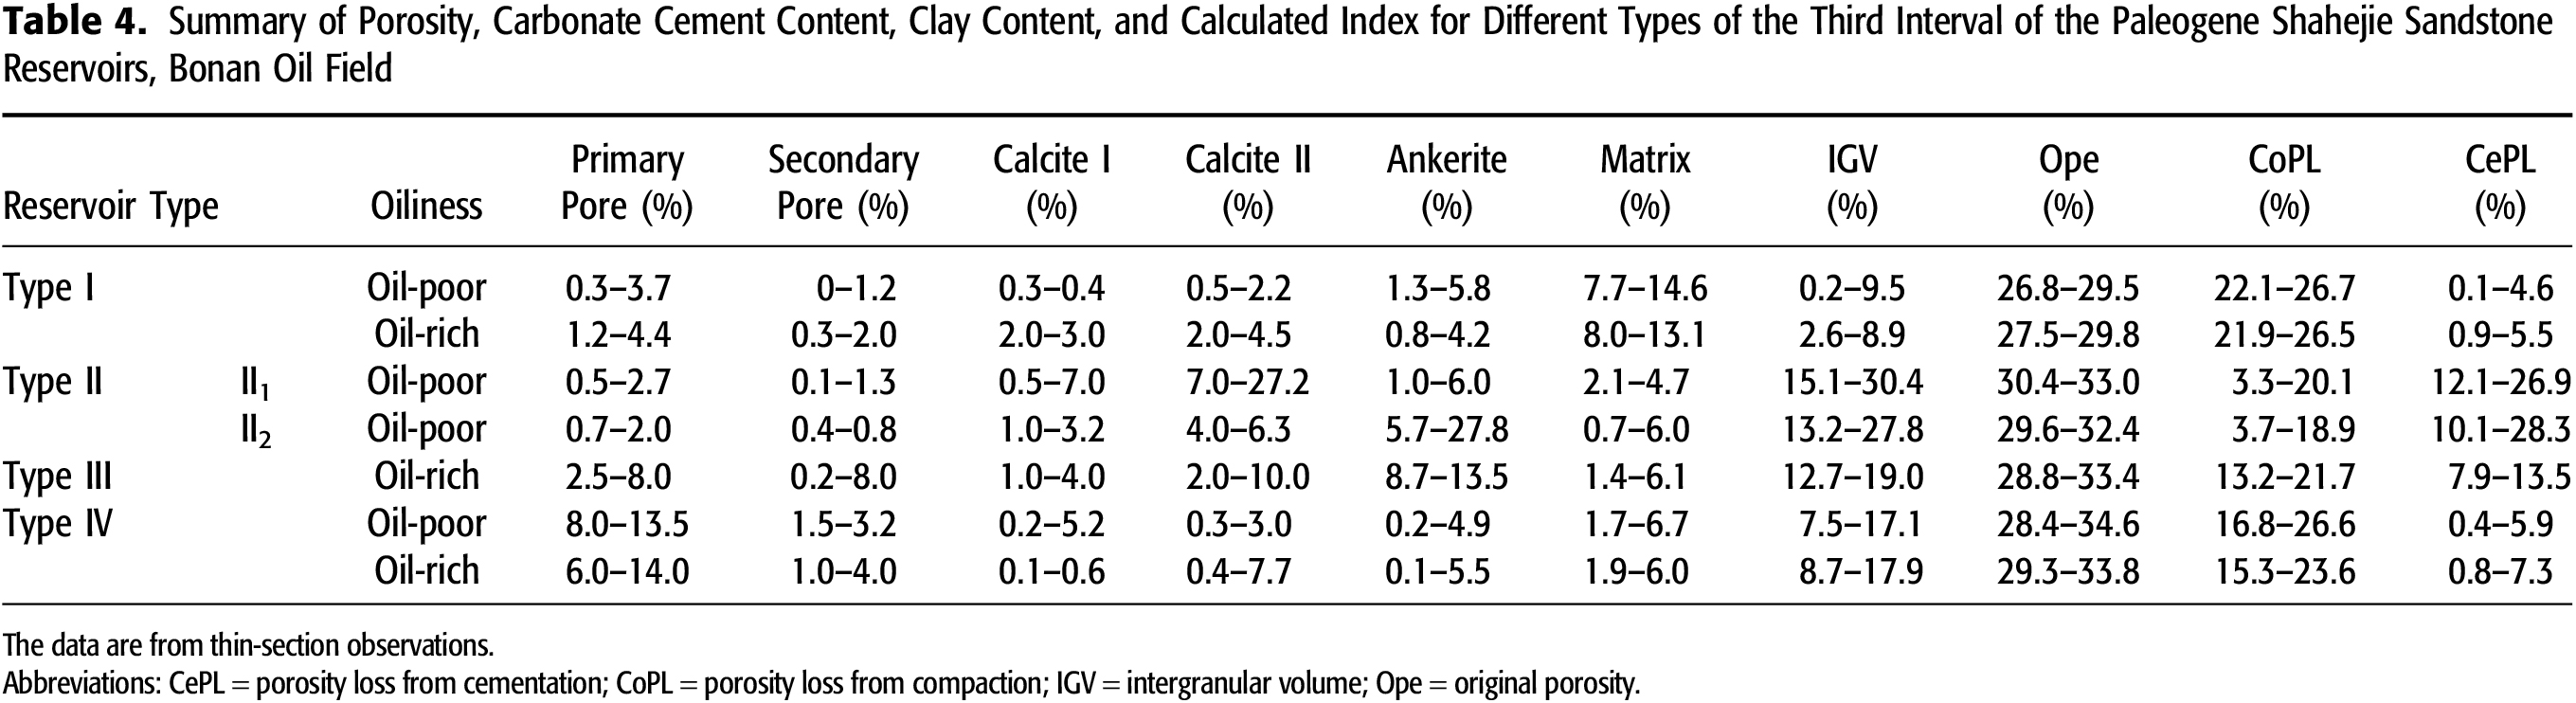
Type I: This type of sandstone reservoir is characterized by high clay content, low carbonate cement content, and low porosity of less than 5% (Table 4). The porosity loss of the type I sandstone reservoirs is mainly due to mechanical compaction, with an average CoPL of 21.9% to 26.7% (Table 4). The type I sandstone reservoirs are rich in clay, with a clay content of 7.7% to 14.6%. The pore space is occupied by compacted clay, leading to the development of tight sandstone reservoirs (Table 4). The porosity loss due to carbonate cementation is minor, with CePL of 0.1% to 5.5% (Table 4). In this model, porosity is reduced early during the eogenetic stage in type I sandstones, primarily due to compaction of ductile clay (Figure 13). The early porosity reduction of the type I sandstone reservoirs may have retarded the inflow of diagenetic liquid, as well as the consequential carbonate cementation and dissolution. The secondary porosity from dissolution is less than 2.0% (Table 4). In the mesogenetic stage, there was little change in the porosity for the type I sandstone reservoirs (Figure 13). Oil emplacement in the late mesogenetic stage exerted little influence on the compacted type I sandstone reservoirs. The type I sandstone reservoirs have visual porosity of 0.3% to 4.4% and are suggested as low-quality reservoirs in the Es3 interval (Table 4).
The clay content in reservoirs is mainly controlled by sedimentary facies. In the braided river delta deposits of the Es3 interval, the deposits in underwater natural levee, intertributary bay, and distal bar microfacies are characterized by thin interbedding siltstone, silty mudstone, and mudstone with high content of clay (Kang et al., 2002; Li et al., 2002). The sandstones from those sedimentary microfacies are more likely to experience strong mechanical compaction, leading the formation of the type I sandstone reservoirs.
Type II: This type of sandstone reservoir is characterized by low clay content, pervasive carbonate cementation, and low oil saturation (Table 4). The type II sandstone reservoirs present relatively low CoPL of 3.3% to 20.1% and low clay content of 0.7% to 6.0% (Table 4). The porosity loss is mainly due to carbonate cementation, with an average CePL of 10.1% to 28.3% (Table 4). Due to the low ductile clay content, the type II reservoirs’ rigid grains effectively resisted mechanical compaction and resulted in a slow porosity decline in the eogenetic stage (Figure 13). There are two different circumstances on the porosity evolution in the type II reservoirs, according to the types of carbonate cement. The type II1 reservoir presents high calcite II content and low ankerite content (Table 4). This type of reservoir was cemented during the early mesogenetic stage, resulting in limited remaining pore space for subsequent ankerite cementation during the late mesogenetic stage (Figure 13). Significant porosity and permeability reduction from early calcite II cementation limited the amount of available pore space, resulting in relatively low oil saturation in type II1 reservoirs. The type II2 reservoirs have low calcite II content and high ankerite content (Table 4). Porosity of the type II2 reservoirs declined relatively slowly in the early mesogenetic stage, with low calcite II content compared with the type II1 sandstone reservoir (Figure 13). Without the influence of oil emplacement, the type II2 reservoirs displayed rapid porosity decline with extensive ankerite cementation in the later mesogenetic stage (Figure 13). Quartz and feldspar mineral dissolution also occurred in the eogenetic and mesogenetic stage in the type II reservoirs. However, the primary and secondary pores were occupied by calcite II and ankerite cements with an average visual porosity ranging from 0.6% to 4% (Table 4). The type II reservoirs tend to form low-quality sandstone reservoirs in the Es3 interval.
It is widely accepted that carbonate cementation is strong for sandstones near the sand–mud interface or interbedding with mudstone because the material source for carbonate cementation may be supplied by adjacent mudstones (dos Anjos et al., 2000; Thyne et al., 2001; Dutton, 2008; Mansurbeg et al., 2009; Ma et al., 2015a; Yuan et al., 2015). The ions needed for carbonate cementation, such as Ca2+, Mg2+, and Fe2+, have a maximum concentration at the contact interface of sand–mud (Ma et al., 2015b). In the sandstone reservoirs of the Es3 interval, the carbonate cementation primarily developed in sandstones with low clay content, such as the sandstones from underwater distributional channel or river mouth bar microfacies (Li et al., 2002). Therefore, the sandstone from those favorable microfacies adjacent to mudstones is most likely to develop extensive carbonate cementation.
Type III: This type of sandstone reservoir is characterized by low content of clay, moderate carbonate cementation, and high oil saturation. The type III sandstone reservoirs have a CoPL of 13.2% to 21.7% and an average CePL of 7.9% to 13.5%, with the clay content of 1.4% to 6.1%. Similar to the type II2 sandstone reservoirs, the type III sandstone reservoirs effectively preserved primary porosity from mechanical compaction in the eogenetic stage and from calcite II cementation in the early mesogenetic stage (Figure 13). There was oil emplacement in the type III reservoirs during the late mesogenetic stage. With the influence of oil emplacement, the type III reservoirs developed relatively less ankerite cements in the late mesogenetic stage. Therefore, the type III reservoirs present similar calcite II cements compared with the type II2 reservoirs but a lower ankerite content of 8.7% to 13.5% (Table 4). The contrast between the type II1 and the type III sandstone reservoirs indicates that oil could have preferentially accumulated in high-quality reservoirs, which can also lead to higher porosity preservation in the sandstone reservoirs with high oil saturation. The influence of oil emplacement on reservoir quality is based on the relationship between oil emplacement and diagenetic sequence of sandstone reservoirs. The type III sandstone reservoirs preserved more primary and secondary porosity, with visual porosity of 2.7% to 16.0% (Table 4), defined as medium-quality sandstone reservoirs in the Es3 interval. Oil was preferentially accumulated in the top part of the sand body (Figure 15).
Type IV: This type of reservoir developed in the layers of sandstone and away from the sand–mud interface, which has relatively low clay content, limited carbonate cementation, and high porosity. Porosity loss of the type IV reservoirs was mainly due to CoPL, with little contribution from CePL of 0.4% to 7.3% (Table 4). With clay content of 1.7% to 6.7%, the type IV reservoirs effectively retarded mechanical compaction and preserved numerous primary pores from compacted clay (Figure 13). During the mesogenetic stage, porosity reduction of the type IV reservoirs was less than the type II reservoirs due to less carbonate cementation (Figure 12). Secondary porosity from mineral grain dissolution in the eogenetic and mesogenetic stage could be effectively preserved. Therefore, the type IV reservoirs have the secondary porosity of 1.0% to 4.0% (Table 4). The type IV reservoirs have visual porosity of 7.0% to 18% and are categorized as high-quality sandstone reservoirs in the Es3 interval (Table 4).
CONCLUSIONS
The Es3 sandstone reservoirs of the Bonan oil field have experienced complex porosity evolution. Mechanical compaction of clay-rich sandstone resulted in reservoirs with porosity less than 5% during the eogenetic stage. Carbonate cementation was detrimental for porosity, increasing up to 8% in the clay-poor sandstone reservoirs. Carbonate cements ranging from 0.6% to 37.3% in the sandstone reservoirs of the Es3 interval are dominated by ferrous calcite and ankerite, which were mostly precipitated during the mesogenetic stage. The oil charge is thought to have inhibited further late mesogenetic carbonate cementation, primarily ankerite.
The Es3 sandstone reservoirs are classified as four categories, according to porosity evolution. The type I sandstone reservoirs are rich in clay and display rapid porosity loss more than 28% caused by mechanical compaction during the eogenetic stage and have little porosity change, of less than 3%, in the mesogenetic stage. The type II sandstone reservoirs with little amounts of clay could effectively retard mechanical compaction in the eogenetic stage. However, in the mesogenetic stage, pervasive carbonate cementation occupied pore space and caused significant porosity loss of more than 14% in the type II sandstone reservoirs that were deposited adjacent to or interbedded with calcareous mudstone intervals. The oil emplacement of the type III sandstone reservoir retarded the subsequent ankerite cementation in the late mesogenetic stage. Therefore, the type III sandstone reservoirs have higher porosity and less carbonate cementation compared with the type II sandstone reservoirs. The impact of oil emplacement on reservoir quality depends on the charging time relative to diagenetic processes. The type IV sandstone reservoirs with little clay and carbonate cements show the slowest porosity decline in the whole porosity evolution; they are the most porous sandstone reservoirs in the Es3 interval.
The type III and type IV sandstone reservoirs are the favorable oil reservoirs in the Es3 interval of the Bonan oil field. The sandstone reservoirs have low content of clay and carbonate cements. The lower degrees of compaction and calcite cementation are factors controlled by deposition. The low amount of ankerite cement is inferred to be the result of oil charge. The research results describing the effect of oil charge and carbonate cements on porosity preservation can help to guide the reservoir quality prediction and resource potential assessment in sandstone reservoirs in the rifted lacustrine basin of eastern China.
APPENDIX
The oil saturation, porosity, cement content, and minerals compositions for the select samples of sandstone reservoirs in the Es3 interval in the Bonan oil field are shown in Table 5.

REFERENCES CITED
Aase, N. E., P. A. Bjørkum, and P. H. Nadeau, 1996, The effect of grain-coating microquartz on preservation of reservoir porosity: AAPG Bulletin, v. 80, no. 10, p. 1654–1673, doi:10.1306/64EDA0F0-1724-11D7-8645000102C1865D.
Aase, N. E., and O. Walderhaug, 2005, The effect of hydrocarbons on quartz cementation: Diagenesis in the Upper Jurassic sandstones of the Miller Field, North Sea, revisited: Petroleum Geoscience, v. 11, no. 3, p. 215–223, doi:10.1144/1354-079304-648.
Ajdukiewicz, J. M., P. H. Nicholson, and W. L. Esch, 2010, Prediction of deep reservoir quality using early diagenetic process models in the Jurassic Norphlet Formation, Gulf of Mexico: AAPG Bulletin, v. 94, no. 8, p. 1189–1227, doi:10.1306/04211009152.
Beard, D. C., and P. K. Weyl, 1973, Influence of texture on porosity and permeability of unconsolidated sand: AAPG Bulletin, v. 57, no. 2, p. 349–369, doi:10.1306/819A4272-16C5-11D7-8645000102C1865D.
Bjorkum, P. A., and P. H. Nadeau, 1998, Temperature controlled porosity/permeability reduction, fluid migration, and petroleum exploration in sedimentary basins: The APPEA Journal, v. 38, no. 1, p. 453–465, doi:10.1071/aj97022.
Bjørlykke, K., ed., 2015, Petroleum geoscience: From sedimentary environments to rock physics: Heidelberg, Germany, Springer-Verlag Berlin, 663 p., doi:10.1007/978-3-642-34132-8.
Bloch, S., R. H. Lander, and L. Bonnell, 2002, Anomalously high porosity and permeability in deeply buried sandstone reservoirs: Origin and predictability: AAPG Bulletin, v. 86, no. 2, p. 301–328, doi:10.1306/61EEDABC-173E-11D7-8645000102C1865D.
Boles, J. R., and S. G. Franks, 1979, Clay diagenesis in Wilcox Sandstones of SW Texas: Implications of smectite diagenesis on sandstone cementation: Journal of Sedimentary Petrology, v. 49, no. 1, p. 55–70, doi:10.1306/212F76BC-2B24-11D7-8648000102C1865D.
Burley, S. D., J. Mullis, and A. Matter, 1989, Timing diagenesis in the Tartan reservoir (UK North Sea): Constraints from combined cathodoluminescence microscopy and fluid inclusion studies: Marine and Petroleum Geology, v. 6, no. 2, p. 98–120, doi:10.1016/0264-8172(89)90014-7.
Cai, J. G., Z. H. Zhang, X. M. Zhu, Z. H. Xie, Y. X. Li, H. J. Liu, and D. S. Yuan, 2003, Hydrocarbon filling and chemical diagenesis evolution of the clastic reservoir of the Paleogene in Dongying Sag: Petroleum Exploration and Development, v. 30, no. 3, p. 79–83.
Dickson, J. A. D., 1966, Carbonate identification and genesis as revealed by staining: Journal of Sedimentary Research, v. 36, no. 2, p. 491–505, doi:10.1306/74D714F6-2B21-11D7-8648000102C1865D.
dos Anjos, S. M. C., L. F. De Ros, R. S. de Souza, C. M. D. Silva, and C. L. Sombra, 2000, Depositional and diagenetic controls on the reservoir quality of Lower Cretaceous Pendencia sandstones, Potiguar rift basin, Brazil: AAPG Bulletin, v. 84, no. 11, p. 1719–1742, doi:10.1306/8626C375-173B-11D7-8645000102C1865D.
Dutton, S. P., 2008, Calcite cement in Permian deep-water sandstones, Delaware Basin west Texas: Origin, distribution, and effect on reservoir properties: AAPG Bulletin, v. 92, no. 6, p. 765–787, doi:10.1306/01280807107.
Ehrenberg, S. N., 1989, Assessing the relative importance of compaction processes and cementation to reduction of porosity in sandstones: Discussion; compaction and porosity evolution of Pliocene sandstones, Ventura Basin, California: Discussion: AAPG Bulletin, v. 73, no. 10, p. 1274–1276, doi:10.1306/44B4AA1E-170A-11D7-8645000102C1865D.
Fayek, M., T. M. Harrison, M. Grove, K. D. McKeegan, C. D. Coath, and J. R. Boles, 2001, In situ stable isotopic evidence for protracted and complex carbonate cementation in a petroleum reservoir, North Coles Levee, San Joaquin Basin, California, USA: Journal of Sedimentary Research, v. 71, no. 3, p. 444–458, doi:10.1306/2dc40954-0e47-11d7-8643000102c1865d.
Folk, R. L., P. B. Andrews, and D. W. Lewis, 1970, Detrital sedimentary rock classification and nomenclature for use in New Zealand: New Zealand Journal of Geology and Geophysics, v. 13, no. 4, p. 937–968, doi:10.1080/00288306.1970.10418211.
Friedman, I., and J. R. O’Neil, 1977, Compilation of stable isotope fractionation factors of geochemical interest: Washington, DC, US Geological Survey Professional Paper 440-KK, 117 p.
Han, J., X. Guo, T. Dong, S. He, Y. Wang, X. Wang, Y. Hua, Z. Wen, and J. Chen, 2020, Oil origin and secondary migration pathway in the Bonan sag, Bohai Bay Basin, China: Marine and Petroleum Geology, v. 122, 104702, 15 p., doi:10.1016/j.marpetgeo.2020.104702.
Han, S. J., B. S. Yu, Z. Ruan, C. Y. Bai, Z. H. Shen, and S. C. Lohr, 2021, Diagenesis and fluid evolution in the third member of the Eocene Shahejie Formation, Bonan Sag, Bohai Bay Basin, China: Marine and Petroleum Geology, v. 128, 105003, 14 p., doi:10.1016/j.marpetgeo.2021.105003.
Han, Y. J., S. He, G. Q. Song, Y. S. Wang, X. F. Hao, B. J. Wang, and S. Y. Luo, 2012, Origin of carbonate cements in the overpressured top seal and adjacent sandstones in Dongying depression: Acta Petrolei Sinica, v. 33, no. 3, p. 385–393, doi:10.7623/syxb201203007.
Hendry, J. P., M. Wilkinson, A. E. Fallick, and R. S. Haszeldine, 2000, Ankerite cementation in deeply buried Jurassic sandstone reservoirs of the central North Sea: Journal of Sedimentary Research, v. 70, no. 1, p. 227–239, doi:10.1306/2dc4090d-0e47-11d7-8643000102c1865d.
Hower, J., E. V. Eslinger, M. E. Hower, and E. A. Perry, 1976, Mechanism of burial metamorphism of argillaceous sediments: Mineralogical and chemical evidence: GSA Bulletin, v. 87, no. 5, p. 725–737, doi:10.1130/0016-7606(1976)87<725:MOBMOA>2.0.CO;2.
Jia, C., W. Zhao, C. Zou, Z. Feng, X. Yuan, Y. Chi, S. Tao, and S. Xue, 2007, Geological theory and exploration technology for lithostratigraphic hydrocarbon reservoirs [in Chinese with English abstract]: Petroleum Exploration and Development, v. 34, no. 3, p. 257–272.
Kang, R., K. Liu, C. Zhao, P. Jin, D. Peng, S. Luo, W. Li, and Z. Gao, 2002, Sedimentary facies of the Shahejie Formation of Paleogene in Bonan Sag of Jiyang Depression [in Chinese with English abstract]: Journal of Palaeogeography, v. 4, no. 4, p. 19–29.
Li, H., X. Du, Q. Wang, X. Yang, H. Zhu, and F. Wang, 2020, Formation of abnormally high porosity/permeability in deltaic sandstones (Oligocene), Bozhong depression, offshore Bohai Bay Basin, China: Marine and Petroleum Geology, v. 121, 104616, 26 p., doi:10.1016/j.marpetgeo.2020.104616.
Li, P., Z. Jin, S. Zhang, X. Pang, H. Xiao, and Z. Jiang, 2003, The present research status and progress of petroleum exploration in the Jiyang Depression [in Chinese with English abstract]: Petroleum Exploration and Development, v. 30, no. 3, p. 1–4.
Li, W.-f., Z.-z. Gao, D.-t. Peng, S.-s. Luo, and Y.-b. He, 2002, Sedimentary facies of the Paleogene Shahejie Formation in the Bonan depression, Shengli Oil Field [in Chinese with English abstract]: Sedimentary Geology and Tethyan Geology, v. 22, no. 2, p. 24–30.
Liu, H., Y. Jiang, H. Lu, Y. Liu, and C. Jing, 2016, Restoration of fluid pressure during hydrocarbon accumulation period and fluid inclusion feature in the Bonan Sag [in Chinese with English abstract]: Earth Science, v. 41, no. 8, p. 1384–1394, doi:10.3799/dqkx.2016.109.
Liu, H., Y. Jiang, G. Song, G. Gu, L. Hao, and Y. Feng, 2017, Overpressure characteristics and effects on hydrocarbon distribution in the Bonan Sag, Bohai Bay Basin, China: Journal of Petroleum Science and Engineering, v. 149, p. 811–821, doi:10.1016/j.petrol.2016.11.029.
Ma, B. B., Y. C. Cao, Y. C. Jia, and Y. Z. Wang, 2015a, Formation mechanisms and distribution of high quality reservoirs in deep strata in Palaeogene in northern steep slope zone of Bonan sag, Jiyang depression, China: Journal of Central South University, v. 22, no. 7, p. 2665–2680, doi:10.1007/s11771-015-2797-y.
Ma, B. B., Y. C. Cao, Y. Z. Wang, S. M. Zhang, and Y. C. Jia, 2015b, Diagenetic evolution and its effect on reservoir-quality of fan delta sandstones during progressive burial: Evidence from the upper part of the fourth member of Shahejie formation, Bonan sag, Jiyang depression: Journal of Central South University, v. 22, no. 8, p. 3042–3058, doi:10.1007/s11771-015-2841-y.
Mansurbeg, H., M. A. Caja, R. Marfil, S. Morad, E. Remacha, D. Garcia, T. Martin-Crespo, M. A. K. El-Ghali, and J. P. Nystuen, 2009, Diagenetic evolution and porosity destruction of turbiditic hybrid arenites and siliciclastic sandstones of foreland basins: Evidence from the Eocene Hecho group, Pyrenees, Spain: Journal of Sedimentary Research, v. 79, no. 9, p. 711–735, doi:10.2110/jsr.2009.060.
Marchand, A. M. E., P. C. Smalley, R. S. Haszeldine, and A. E. Fallick, 2002, Note on the importance of hydrocarbon fill for reservoir quality prediction in sandstones: AAPG Bulletin, v. 86, no. 9, p. 1561–1571, doi:10.1306/61EEDD00-173E-11D7-8645000102C1865D.
Molenaar, N., J. Cyziene, S. Sliaupa, and J. Craven, 2008, Lack of inhibiting effect of oil emplacement on quartz cementation: Evidence from Cambrian reservoir sandstones, Paleozoic Baltic Basin: GSA Bulletin, v. 120, no. 9–10, p. 1280–1295, doi:10.1130/b25979.1.
Morad, S., K. Al-Ramadan, J. M. Ketzer, and L. F. De Ros, 2010, The impact of diagenesis on the heterogeneity of sandstone reservoirs: A review of the role of depositional facies and sequence stratigraphy: AAPG Bulletin, v. 94, no. 8, p. 1267–1309, doi:10.1306/04211009178.
Rossi, C., and A. Alaminos, 2014, Evaluating the mechanical compaction of quartzarenites: The importance of sorting (Llanos foreland basin, Colombia): Marine and Petroleum Geology, v. 56, p. 222–238, doi:10.1016/j.marpetgeo.2014.04.012.
Schmidt, V., and D. A. McDonald, 1979, The role of secondary porosity in the course of sandstone diagenesis, in P. A. Scholle and P. R. Schulger, eds., Aspects of diagenesis: Tulsa, Oklahoma, SEPM Special Publication no. 26, p. 175–207, doi:10.2110/pec.79.26.0175.
Stach, E., M. T. Mackowsky, M. Teichmuller, G. H. Taylor, and D. Chandra, 1982, Stach’s textbook of coal petrology: Berlin, Gebruder Borntraeger, 535 p.
Surdam, R. C., L. J. Crossey, E. S. Hagen, and H. P. Heasler, 1989, Organic–inorganic interactions and sandstone diagenesis: AAPG Bulletin, v. 73, no. 1, p. 1–23, doi:10.1306/703C9AD7-1707-11D7-8645000102C1865D.
Taylor, T. R., M. R. Giles, L. A. Hathon, T. N. Diggs, N. R. Braunsdorf, G. V. Birbiglia, M. G. Kittridge, C. I. Macaulay, and I. S. Espejo, 2010, Sandstone diagenesis and reservoir quality prediction: Models, myths, and reality: AAPG Bulletin, v. 94, no. 8, p. 1093–1132, doi:10.1306/04211009123.
Thyne, G., B. P. Boudreau, M. Ramm, and R. E. Midtbo, 2001, Simulation of potassium feldspar dissolution and illitization in the Statfjord Formation, North Sea: AAPG Bulletin, v. 85, no. 4, p. 621–635, doi:10.1306/8626C965-173B-11D7-8645000102C1865D.
Wang, Y., M. Li, X. Pang, S. Zhang, D. Shi, and Dongxia, 2005, Fault-fracture mesh petroleum plays in the Zhanhua Depression, Bohai Bay Basin: Part 1. Source rock characterization and quantitative assessment: Organic Geochemistry, v. 36, no. 2, p. 183–202, doi:10.1016/j.orggeochem.2004.08.003.
Worden, R. H., M. Bukar, and P. Shell, 2018, The effect of oil emplacement on quartz cementation in a deeply buried sandstone reservoir: AAPG Bulletin, v. 102, no. 1, p. 49–75, doi:10.1306/02071716001.
Worden, R. H., N. H. Oxtoby, and P. C. Smalley, 1998, Can oil emplacement prevent quartz cementation in sandstones?: Petroleum Geoscience, v. 4, no. 2, p. 129–137, doi:10.1144/petgeo.4.2.129.
Xi, K., Y. Cao, J. Jahren, R. Zhu, K. Bjørlykke, B. G. Haile, L. Zheng, and H. Hellevang, 2015, Diagenesis and reservoir quality of the Lower Cretaceous Quantou Formation tight sandstones in the southern Songliao Basin, China: Sedimentary Geology, v. 330, p. 90–107, doi:10.1016/j.sedgeo.2015.10.007.
Xi, K.-L., Y.-C. Cao, Y.-Z. Wang, Q.-Q. Zhang, J.-H. Jin, R.-K. Zhu, S.-M. Zhang, J. Wang, T. Yang, and L.-H. Du, 2015, Factors influencing physical property evolution in sandstone mechanical compaction: The evidence from diagenetic simulation experiments: Petroleum Science, v. 12, no. 3, p. 391–405, doi:10.1007/s12182-015-0045-6.
Xia, C. Y., M. Wilkinson, and S. Haszeldine, 2020, Petroleum emplacement inhibits quartz cementation and feldspar dissolution in a deeply buried sandstone: Marine and Petroleum Geology, v. 118, 104449, 10 p., doi:10.1016/j.marpetgeo.2020.104449.
Yang, T., Y. Cao, H. Friis, K. Liu, Y. Wang, L. Zhou, G. Yuan, K. Xi, and S. Zhang, 2020, Diagenesis and reservoir quality of lacustrine deep-water gravity-flow sandstones in the Eocene Shahejie Formation in the Dongying sag, Jiyang depression, eastern China: AAPG Bulletin, v. 104, no. 5, p. 1045–1073, doi:10.1306/1016191619917211.
Yang, T., Y. C. Cao, H. Friis, K. Y. Liu, Y. Z. Wang, L. L. Zhou, S. M. Zhang, and H. N. Zhang, 2018, Genesis and distribution pattern of carbonate cements in lacustrine deepwater gravity-flow sandstone reservoirs in the third member of the Shahejie Formation in the Dongying Sag, Jiyang Depression, Eastern China: Marine and Petroleum Geology, v. 92, p. 547–564, doi:10.1016/j.marpetgeo.2017.11.020.
Yang, Y.-x., Z.-k. Jin, Y.-x. Lu, L.-y. Diao, P. Wang, and C.-h. Liu, 2014, Characteristics and formation of high quality reservoirs in sediment gravity flows of Gangzhong area, Huanghua depression: Journal of Central South University, v. 21, no. 2, p. 745–752, doi:10.1007/s11771-014-1997-1.
Yuan, G. H., Y. C. Cao, J. Gluyas, X. Y. Li, K. L. Xi, Y. Z. Wang, Z. Z. Jia, P. P. Sun, and N. H. Oxtoby, 2015, Feldspar dissolution, authigenic clays, and quartz cements in open and closed sandstone geochemical systems during diagenesis: Typical examples from two sags in Bohai Bay Basin, East China: AAPG Bulletin, v. 99, no. 11, p. 2121–2154, doi:10.1306/07101514004.
Zhang, J.-l., D.-y. Li, and Z.-q. Jiang, 2010, Diagenesis and reservoir quality of the fourth member sandstones of Shahejie formation in Huimin depression, eastern China: Journal of Central South University of Technology, v. 17, no. 1, p. 169–179, doi:10.1007/s11771-010-0027-1.
AUTHORS
Xiaowen Guo received his Ph.D. in petroleum geology from China University of Geosciences (Wuhan) in 2010. He is now a professor of petroleum geology at China University of Geosciences (Wuhan). His main research interests include evolution of reservoir fluid, overpressure, and petroleum accumulation in sedimentary basins.
Yanqi Hua received his Ph.D. in petroleum geology from China University of Geosciences (Wuhan) in 2022. He is now an engineer at CNOOC Ltd., Tianjin Branch. His research interests include hydrocarbon accumulation and reservoir diagenesis.
Bin Wang received his Ph.D. in petroleum geology from China University of Geosciences (Wuhan) in 2022. He is a senior geological engineer at the Wuxi Research Institute of Petroleum Geology, Sinopec. His research interests include basin analysis, reservoir diagenesis, and hydrocarbon accumulation.
Zhi Yang is a professor-level senior engineer at the PetroChina Research Institute of Petroleum Exploration and Development. He graduated from China University of Geosciences (Wuhan) with a B.S. degree and Ph.D. in mineral resource prospecting and exploration in 2004 and 2009, respectively. His major scientific interests include geological analysis on unconventional shale oil and gas systems, tight oil and gas systems, and prospecting of potential conventional–unconventional petroleum and other mineral resources in super energy basins. He is a corresponding author of this paper.
Zhiliang He is a full professor at the China University of Geosciences (Wuhan). He holds a guest professorship at the Peking University and honorary professorships at the China University of Geosciences (Beijing). He is an elected fellow of the Geological Society of China. His research interests cover geological exploration of conventional and unconventional resources, including shale oil and gas, carbonate reservoirs, and hydrothermal systems. He is a corresponding author of this paper.
Tian Dong received his Ph.D. from the University of Alberta in 2016. He is currently a professor at the China University of Geosciences. His main research interests include geochemistry, petrophysics, and diagenesis in shale formations.
Keyu Liu is a professor at the China University of Petroleum (East China) and is an adjunct fellow at the Commonwealth Scientific and Industrial Research Organization (CSIRO) and Curtin University working on petroleum system analysis. He has a B.Sc. degree from China Ocean University, an M.Sc. degree from the University of Sydney, and a Ph.D. from the Australian National University. He previously worked at CSIRO and PetroChina on reservoir characterization, stratigraphic modeling, fluid history analysis, and petroleum system modeling for 25 years and is a member of AAPG and the Society of Petroleum Engineers.
Sheng He received his B.S. and M.S. degrees in petroleum geology from the China University of Geosciences and his Ph.D. in geology from Curtin University of Technology in Australia. He is currently a professor of petroleum geology at the Department of Petroleum Geology, Faculty of Earth Resources, China University of Geosciences (Wuhan). His research interests include petroleum geochemistry, shale gas, and overpressure generation and evaluation.
ACKNOWLEDGMENTS
This research was financially supported by the National Key Research and Development Program of China (Grant Nos. 2023YFF0804300 and 2023YFF0804304) and the National Natural Science Foundation of China (Grant No. U20B6001). The Shengli Oilfield Research Institute, Sinopec, is thanked for providing background geological data and the permission to publish the results.