The AAPG/Datapages Combined Publications Database
AAPG Bulletin
Full Text
![]() Click to view page images in PDF format.
Click to view page images in PDF format.
AAPG Bulletin, V.
DOI: 10.1306/08182220071
Recommended practices in exploration assurance
Marc Bond,1 Gary P. Citron,2 and Doug Weaver3
1Rose & Associates, LLP, London, United Kingdom; [email protected]
2Rose & Associates, LLP, Tampa, Florida; [email protected]
3Rose & Associates, LLP, Houston, Texas; [email protected]
ABSTRACT
In oil and gas exploration, technical teams build subsurface assessments from many data sources. From these assessments, teams extract values that quantify a prospect’s resource uncertainty and the probability of success. These values feed economic evaluations and become the building blocks of an exploration portfolio. Predictable portfolio management depends upon the reliability and accuracy of these prospect quantifications. Assurance teams can provide technical teams with objective, independent, and consistent guidance for these assessments to enhance ![]() predictive
predictive![]() accuracy. In this paper, the authors summarize our 40 yr of experience characterizing exploration opportunities, participating in or leading company assurance teams, and collaborating with industry assurance practitioners to share key attributes of an effective assurance process. Assurance teams are most effective when they (1) serve as independent groups engaging with technical teams; (2) have a defined yet flexible process; (3) have experienced team members with good interpersonal, listening, and writing skills; (4) can assess opportunities multiple times during the life cycle of a prospect; and (5) conduct and report on postwell analysis to drive positive change. The desired outcome of effective exploration assurance is management being confident that the company technical evaluations are consistent and reliable. This provides a sound basis for managing a portfolio and making informed decisions.
accuracy. In this paper, the authors summarize our 40 yr of experience characterizing exploration opportunities, participating in or leading company assurance teams, and collaborating with industry assurance practitioners to share key attributes of an effective assurance process. Assurance teams are most effective when they (1) serve as independent groups engaging with technical teams; (2) have a defined yet flexible process; (3) have experienced team members with good interpersonal, listening, and writing skills; (4) can assess opportunities multiple times during the life cycle of a prospect; and (5) conduct and report on postwell analysis to drive positive change. The desired outcome of effective exploration assurance is management being confident that the company technical evaluations are consistent and reliable. This provides a sound basis for managing a portfolio and making informed decisions.
THE PERSISTENT RESOURCE ESTIMATION CHALLENGE
The extent of the resource overestimation problem became apparent at the 1995 AAPG Hedberg Conference dedicated to petroleum risk management (MacKay, 1996). Otis and Schneidermann (1997) provided an early glimpse of Chevron’s poor ![]() predictive
predictive![]() accuracy of resource estimation in advance of their commitment to an assurance initiative. Harper (2000) described similar resource overestimation problems at BP, particularly as it related to their exploration of deep-water prospects, which were investigated with their most advanced predrill technologies. More recent publications (Ward and Whitaker, 2016; Milkov, 2017) and presentations (Bagley and Bond, 2018; Søiland, 2019) suggest that accurate resource estimation remains a challenge.
accuracy of resource estimation in advance of their commitment to an assurance initiative. Harper (2000) described similar resource overestimation problems at BP, particularly as it related to their exploration of deep-water prospects, which were investigated with their most advanced predrill technologies. More recent publications (Ward and Whitaker, 2016; Milkov, 2017) and presentations (Bagley and Bond, 2018; Søiland, 2019) suggest that accurate resource estimation remains a challenge.
Figure 1 illustrates the problem, indicating the overconfidence bias at companies operating in the Norwegian North Sea (Søiland, 2019). Predrill resource estimates in license applications largely overestimated resource potential, predominantly falling in the shaded triangle below the central diagonal perfect prediction line. Many predrill estimates were overestimated by a factor of 10 and some by nearly a factor of 100.
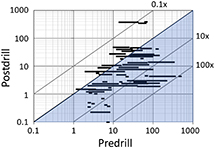 Figure 1. Log–log crossplot of predrill versus postdrill prospect resources compiled from Norwegian Petroleum Directorate license applications. Units for both axes are millions of standard cubic meters of oil equivalent. The length of the bars represents the predrill 80% confidence range defined as a 10% chance the outcome will be below the low end of the range (known as the 90th percentile) and a 10% chance the outcome will exceed the high end of the range. Central diagonal line represents perfect prediction. Data that fall on the diagonal lines labeled 10× and 100× represent overestimation by a factor of 10 and 100, respectively. Redrawn from slide 13 from Søiland (2019).
This problem afflicts explorers around the world. The data from Figure 1 are shown as a black line, recast in percentile histogram format in Figure 2. The y axis records the percentage of discoveries that fell in a particular percentile interval from that prospect’s predrill estimated ultimate recoverable resource (EUR) distribution. Each gray line represents different companies’ ![]() predictive
predictive![]() performance exploring in various basins worldwide during the last three decades. The high percentage of discoveries falling beneath the 80th percentile (P80) of the predrill EUR distribution indicate consistent overestimation of prospect resources. By definition, only 20% of the outcomes should fall below the P80. (This paper uses the “greater than” convention, where P20 > P80). Ideally, in an unbiased estimating system, 20% of the discoveries would fall in each quintile.
performance exploring in various basins worldwide during the last three decades. The high percentage of discoveries falling beneath the 80th percentile (P80) of the predrill EUR distribution indicate consistent overestimation of prospect resources. By definition, only 20% of the outcomes should fall below the P80. (This paper uses the “greater than” convention, where P20 > P80). Ideally, in an unbiased estimating system, 20% of the discoveries would fall in each quintile.
 Figure 2. A percentile histogram plot, where the y axis plots the percentage of discoveries that fell within each predrill estimated ultimate recoverable resource (EUR) quintile bucket. The EUR represents the volume of hydrocarbons, at standard conditions, that ultimately will be recovered from a reservoir before abandonment. The far left (smallest) quintile bucket is bound on the high side by the 80th percentile (P80) so that there is an 80% chance that the outcome will be that amount, or higher; the far right (largest) quintile is bound on the low side by the 20th percentile [P20], so that there is a 20% chance that the outcome will be that amount, or higher. Note the pervasive optimistic bias, with a far greater percentage of discovered field sizes falling below the P80, compared to the outcomes of an unbiased system in which 20% of the results would fall in each quintile. The bold black line represents the data from Figure 1. Source: Rose & Associates’ fourteen studies of published papers and unpublished consultations covering data from the mid-1980s to 2015 across a wide range of basins worldwide. Published papers are annotated by number at the far left of each track: 1 = Moeller (2015); 2 = Søiland (2019) data are bold and recast from Figure 1; 7 = Alexander and Lohr (1998); 8 = Otis and Schneidermann (1997).
Many reasons exist for the persistent overestimation. Capen (1976) first addressed the universal tendency to understate the amount of uncertainty in prospect parameter estimates. Rose and Citron (2000) described the unfailing persistence and eternal optimism associated with the “prospector myth.” Kahneman (2011) summarized overconfidence and other categories of bias that he and his colleague Amos Tversky researched for five decades. They described the difficulty of eliminating bias, a point Rose (2017) corroborated for the oil and gas industry.
THE CASE FOR ASSURANCE IN PORTFOLIO MANAGEMENT
Assurance describes the process of providing independent reality and perspective checks on resource estimation parameters and chance assessment. This helps in reducing bias and providing justified confidence to those who make business decisions. Larger exploration and production (E&P) companies likely started rigorous assurance procedures in the 1980s (Sluijk and Parker, 1986). Adoption of assurance processes became more widespread in the early 1990s, partly in response to failed growth efforts that destroyed shareholder value (Hart, 1988; Rose, 2001, 2012).
Otis and Schneidermann (1997) documented the positive impact of assurance on Chevron’s ![]() predictive
predictive![]() performance. Although their paper outlined the process for predrill volume and chance assessment, the greatest impact on predictability came from coupling the assessment process with rigorous assurance (R. Otis, 2003, personal communication). Twenty years later, Rudolph and Goulding (2017) reported on the calibration of their compiled chance of economic success forecasts to the actual economic success rate for 553 ExxonMobil conventional prospects drilled between 1994 and 2015. Although they do not mention the word “assurance,” they do refer to (1) prospect assessments that were further evaluated in a structured peer review by senior advisors; (2) longstanding adherence to worldwide assessment standards; and (3) application of a unified upstream risk model (Sykes et al., 2011) to facilitate consistency. Van Mastrigt and Quinn (2021) highlighted, among other factors, that careful assurance of exploration workflows frequently led to outcomes that were consistent with predictions. In addition to these publications, several other presentations (e.g., McMaster, 1997; McMaster and Carragher, 2003; Moeller, 2015; Boyd, 2019) documented improved
performance. Although their paper outlined the process for predrill volume and chance assessment, the greatest impact on predictability came from coupling the assessment process with rigorous assurance (R. Otis, 2003, personal communication). Twenty years later, Rudolph and Goulding (2017) reported on the calibration of their compiled chance of economic success forecasts to the actual economic success rate for 553 ExxonMobil conventional prospects drilled between 1994 and 2015. Although they do not mention the word “assurance,” they do refer to (1) prospect assessments that were further evaluated in a structured peer review by senior advisors; (2) longstanding adherence to worldwide assessment standards; and (3) application of a unified upstream risk model (Sykes et al., 2011) to facilitate consistency. Van Mastrigt and Quinn (2021) highlighted, among other factors, that careful assurance of exploration workflows frequently led to outcomes that were consistent with predictions. In addition to these publications, several other presentations (e.g., McMaster, 1997; McMaster and Carragher, 2003; Moeller, 2015; Boyd, 2019) documented improved ![]() predictive
predictive![]() and business performance through assurance.
and business performance through assurance.
Although publications from two of the largest international explorers either allude to (Otis and Schneidermann, 1997) or infer (Rudolph and Goulding, 2017) the utility of assurance, no publication has specifically addressed the design and implementation of an assurance process as part of its portfolio management system. Before we address this, the following section details some precursory efforts that can facilitate a practical approach to assurance.
AN INTEGRATED APPROACH TO BEST  PRACTICE
 EVALUATIONS
The only true alternative to assurance would be a complete lack of preinvestment oversight, which would not be tolerated in any industry. McMaster (2008) noted that if prospect assessment methodology were standardized and consistently applied across the company without bias, then an assurance team would not be needed. He concluded, however, that until this happens, an assurance team must be considered an exploration best ![]() practice
practice![]() .
.
Various design and implementation elements will differ across various organizations; however, there are some fundamental practices that should be consistent in all organizations.
We note some criticisms of assurance. Examples include (1) viewing assurance as a distraction that creates delays in project completion; (2) biased team members’ stifled creativity; or (3) that dedicated, experienced personnel could have been used elsewhere in the business. Therefore, acknowledging and understanding any criticisms of assurance, if warranted, will better serve successful assurance. While these observations are important, they likely do not reflect a problem with the concept of assurance in portfolio management. Rather, they tend to be associated with a flaw in the assurance design or implementation. Before addressing these, we note that it helps to understand some prerequisites that have facilitated assurance, and how to extract the most value from assurance.
Prerequisites to Assurance
Kahneman et al. (2021) found that good judgment comes from people who are not only experienced and intelligent but also willing to learn. Accordingly, there are several prerequisites that may be considered an alternative approach, but in fact complement assurance. Technical staff training should include best ![]() practice
practice![]() technical evaluation and uncertainty characterization that covers bias awareness and mitigation. Prospect assessment guidelines promote consistency and methods that have best served the company. Subject matter experts should be consulted as needed. Appropriate incentives can reinforce and reward estimation accuracy as well as better business performance (McMaster and Carragher, 2003). For more on quality control concepts, see Milakovich (1995).
technical evaluation and uncertainty characterization that covers bias awareness and mitigation. Prospect assessment guidelines promote consistency and methods that have best served the company. Subject matter experts should be consulted as needed. Appropriate incentives can reinforce and reward estimation accuracy as well as better business performance (McMaster and Carragher, 2003). For more on quality control concepts, see Milakovich (1995).
In describing supportive pillars to successful exploration, Latham and Parkinson (2013) noted better managed companies encouraged
the need to characterize the uncertainty by simply stating they do not want surprises;
access to data and tools to provide context for reality checking a prospect;
learning from failures by making postdrill reviews part of the assessment process; and
pairing exploration innovators with others who help them better navigate company assessment processes.
Assurance as a Means for Integration
The quality control items described above provide the first line of defense against potential inconsistencies in subsurface analysis. Assurance at the very least provides the last line of defense before the investment decision. When integrated, quality control and assurance are more effective than either used alone.
Across an organization, assurance reviews provide additional perspectives on prospect assessment, share best practices, identify weaknesses in evaluations, provide alternatives, and foster consistency. Assurance teams are in a unique position to navigate two interfaces in their companies; they must interact both with staff to assist with opportunity characterization and management to aid in opportunity comparison (Figure 3). To perform this function, assurance needs to
 Figure 3. Assurance processes interface with technical teams generating plays and prospects, and senior management as they make decisions. Modified with permission from Latham and Parkinson (2013).
define common terminologies and use standardized software;
establish and maintain a consistent, systematic, and calibrated assessment process;
implement that process via predrill reviews and provide recommendations as needed to craft unbiased estimates;
bring about calibration using postdrill evaluations, comparing those evaluations with predrill estimates and recommend improvements for positive change; and
provide guidance to management on the technical robustness of the prospect inventory.
Because there are so few peer-reviewed publications dedicated to the role of assurance in the E&P business, and given the persistence of inaccurate estimates, this paper recommends both design and implementation aspects of assurance and practices to avoid bias.
RECOMMENDED ASSURANCE PRACTICES
We categorize assurance practices into two broad areas: design and implementation. Design includes team organization, capability, and management support. Implementation includes the review process and feedback, ownership and accountability of the forecasts, linkage of forecasts to economic models, and distribution of learnings from the experience.
Design
Organization
The assurance team should report directly to the head of exploration and serve all exploration teams as required. The most effective assurance teams have independent dedicated, multidisciplinary core members who interact frequently with technical teams and management. Corporate assurance guidelines can drive consistency by defining terminology, the types and purpose of various reviews, and the logistics to arrange and conduct a review. They should describe what work products are expected from the technical team for these reviews, and in return, the nature and scope of documentation that the assurance team will provide postreview.
Assurance teams formed on an ad hoc basis are less effective, because other assignments and distractions impair evaluation consistency. In some companies, the head of the geoscience and reservoir engineering functions are responsible for assurance, which can present conflicts with other duties.
Regional business unit–based assurance teams are subject to influence by local management, creating a conflict of interest for the technical team and making company-wide consistency more difficult to maintain. To address that problem, Harper (2000) noted enactment of (1) technical networks linking units that discussed problems and shared best practices; (2) rigorous peer assistance sessions in which the prospect team invited individuals from other units to review, advise, and challenge; and (3) incentives for unit managers to forgo funds for their own projects to fund better projects in other units.
Assurance Team Capabilities
The size and composition of the assurance team will vary by company size. The team should include individuals who have not only broad knowledge across several disciplines but also people with deep knowledge in critical exploration specialties. A major positive change in the last decade revealed by the 2019 survey of assurance coordinators (see Appendix) was that 63% of responding assurance teams have a reservoir engineer to assist with the hydrocarbon recovery and development planning inputs.
All team members must have a solid technical foundation in opportunity generation and characterization. The assurance team manager has the primary responsibility for succession planning within the assurance team. Given the long cycle of most E&P projects and reduced exploration budgets, gaining reliable and practical experience can take up to a decade. Individual rotations must be planned across a multiyear horizon to ensure both the consistency and the continuity of the process. An assurance team assignment extended over several budget cycles enables personal calibration across the life cycle of prospects.
While technical excellence and experience are fundamental prerequisites, assurance team members should possess important nontechnical skills. Individuals must demonstrate the ability to listen before providing any challenge. Assurance team members should periodically take steps to understand and mitigate their own personal biases. To gauge their effectiveness, the assurance team can periodically survey the technical teams and managers (Bond, 2008). Ideally, technical teams would see the assurance team as a supporting partner to their evaluations.
Management Support
Boyd (2019) emphatically stated that assurance requires management support to be effective. Assurance teams have been labeled by some as the “risk police,” and McMaster (2008) explored the causes of this derogatory label. He found that some business units allowed prospects to proceed without assurance reviews, and a lack of trust that each business unit would be treated equally in terms of funding. To ensure that assurance is a necessary component of portfolio management, senior management should refuse to consider prospects unless they have been properly assured. A desired state is summarized in the quote, “Assurance provides the underpinning of everything we do in decision-making and portfolio management” (B. Ryan, 2017, personal communication). Building the case for management support inevitably falls to the assurance team and how well they can demonstrate exploration improvement once implemented.
Implementation
Review Process
The assurance process must be sufficiently flexible to address various scales of assessments and externally imposed deadlines. Scheduling assurance reviews is the responsibility of the technical team as their projects approach key decisions. Figure 4 shows the recommended interaction of the assurance and technical teams in a typical exploration project. Given the long life cycle of most E&P projects, the assurance team is most effective when involved at several points as projects mature and in the critical postdrill review. Framing sessions provide early engagement for regional perspective and analog selection. Large complex opportunities typically require several reviews, whereas a small opportunity may only need a single review (Figure 5). The more familiar the assurance team is with an opportunity, the less likely conservatism will manifest itself in their evaluation.
 Figure 4. Simplified exploration process workflow illustrating where assurance interacts with technical teams and decision makers. The diamond symbols represent decision points. Modified with permission from Otis and Schneidermann (1997).
 Figure 5. Description of the various types of reviews charted in Figure 4. The review process moves from being informal, less structured, and collaborative to formal, more structured, and challenging. Symbols are those as introduced in Figure 4.
Feedback
Effective feedback is structured, consistent, timely, and actionable (Phoel, 2009). The assurance team must provide recommended actions, clearly stated in written feedback, ideally delivered within a week of the review. The feedback must include a session summary, agreed-to or recommended revisions of the volumetric distributions, associated chance factors, and suggestions for further technical work with supporting justification. Including the assurance team leader in decision sessions can facilitate discussion on significant subsurface issues. Written documentation is critical to tracking ![]() predictive
predictive![]() performance, particularly because years may separate the final agreed-to predictions and the drilling result.
performance, particularly because years may separate the final agreed-to predictions and the drilling result.
Ownership and Accountability
Accountability for the predictions of resource and geologic chance of success is generally placed with the technical team or manager after having carefully considered the assurance team’s view. Occasionally, the technical team will disagree with the assurance team’s assessment, or it may not be possible to implement the recommendations of the assurance team due to external factors. In these cases, the technical team’s numbers are used for drilling authorization, clearly documenting differences with the assurance team to the decision maker. An alternative approach used in some companies, but not widely adopted, is for the technical teams to present their work to the assurance team. The assurance team then generates and is accountable for the final resource and chance numbers. The technical team’s business unit remains accountable for economic assessment (Citron et al., 2017).
Linkage to Value
The assurance team’s remit may extend into appraisal and development discussions. Many subsurface and above-ground engineering issues can affect project economics of resource and chance assessments (Schneider, 2016). Drivers in the valuation of an opportunity that should similarly benefit from a review process include productive rates, well counts, costs, and investment scheduling. This commercial review should not be part of the resource and chance assurance process. In the track record of large E&P projects, Merrow (2012) described a lack of continuity in project leadership as a contributing cause of poor performance. Ensuring continuity of assurance from exploration through appraisal could help offset this important “handoff” issue. The assurance team can provide management with useful insights into a company’s prospect inventory based on their broad exposure to the opportunity base. They can also identify unique characteristics of prospects, such as dependency between prospects residing in the same play.
Performance Tracking
Performance tracking is the method by which companies evaluate the accuracy of their technical assessments. Citron (2021) provides a historical perspective on the method, and previous sections in this paper have cited several examples that illustrate how performance tracking has aided assurance. The most critical component of performance tracking is a rigorous postdrill review.
The assurance team usually takes the primary responsibility to capture and compile postdrill results. These results are compared with the predrill estimates to identify gaps in prediction accuracy and generate recommendations to close those gaps. Detailed analysis of both the dry holes and successful wells always provides lessons learned. Baird et al. (1999, p. 21) stress that, “A lesson is not learned until something changes.” A best ![]() practice
practice![]() is to review and share key lessons from all recent postdrill evaluations with both the technical teams and management, agreeing on what needs to change. For companies with a small annual portfolio, performance tracking over a multiyear analysis window becomes important for pattern identification.
is to review and share key lessons from all recent postdrill evaluations with both the technical teams and management, agreeing on what needs to change. For companies with a small annual portfolio, performance tracking over a multiyear analysis window becomes important for pattern identification.
McMaster and Carragher (2003) demonstrated the power of performance tracking as an implementation barometer (Figure 6). For a single company they documented widespread resource overestimation in each of the first 3 yr of the assurance process. As assurance progressed the next 3 yr, they recorded resource delivery within acceptable bounds set by management (shaded in Figure 6). Notably, in year 7, they illustrated a dramatic underestimation from drilling a 48-well portfolio that did not result from widespread error, but from just 2 wells. Those 2 wells shared an incorrect seismic time-to-depth conversion uncovered in the postdrill assurance review that was subsequently corrected. The improved workflow was implemented across exploration companywide. Results in year 8 fell back into acceptable bounds.
 Figure 6. A resource prediction accuracy plot. For each year, the results, as measured by the sum of the estimated ultimate recoverable resource (EUR) for the discoveries in the portfolio drilled, are plotted on the portfolio forecast, which probabilistically aggregates all of the prospects drilled by year. The EUR represents the volume of hydrocarbons, at standard conditions, that will ultimately be recovered from a reservoir before abandonment. For each year, there were at least 28 exploration wells in the portfolio. In years 1–3, the result fell below the 80th percentile (P80) of the portfolio forecast, prompting the company to instigate a reward to technical staff if the results fell between the 70th and 30th percentiles (P70 and P30) of that year’s portfolio forecast. By definition, there is an 80% chance that the results will fall at or above the P80. Simplified from McMaster and Carragher (2003) with permission.
CONCLUSIONS
The primary objective of any exploration organization is to deliver on their predictions. Providing accurate predictions is challenging, with many companies making repeated mistakes that destroy value. Based on analysis by multiple data sources, a robust assurance process, coupled with certain quality control processes, can produce a more ![]() predictive
predictive![]() portfolio and contribute to improved business results. A key aspect of the process is a dedicated, multidisciplinary, independent, and centrally controlled assurance team. This team can enhance the
portfolio and contribute to improved business results. A key aspect of the process is a dedicated, multidisciplinary, independent, and centrally controlled assurance team. This team can enhance the ![]() predictive
predictive![]() accuracy of technical team forecasts and improve the decision makers’ confidence in an investment decision. Validation of technical assessments by assurance contributes significantly to consistent and
accuracy of technical team forecasts and improve the decision makers’ confidence in an investment decision. Validation of technical assessments by assurance contributes significantly to consistent and ![]() predictive
predictive![]() portfolio management.
portfolio management.
REFERENCES CITED
Alexander, J. A., and J. R. Lohr, 1998, Risk analysis: Lessons learned: Society of Petroleum Engineers Annual Technical Conference and Exhibition, New Orleans, Louisiana, September 27–30, 1998, SPE-49030-MS, 10 p., doi:10.2118/49030-MS.
Bagley, G., and M. Bond, 2018, Prospect risking and volume benchmarking using Wildcat data: London, United Kingdom, Westwood Global Energy Report, 29 p., accessed January 22, 2019, https://www.westwoodenergy.com/reports/prospect-risk-and-benchmarking-using-wildcat.
Baird, L., P. Holland, and S. Deacon, 1999, Learning from action: Imbedding more learning into the performance fast enough to make a difference: Organizational Dynamics, v. 27, no. 4, p. 19–32, doi:10.1016/S0090-2616(99)90027-X.
Bond, M., 2008, Exploration assurance team: Assurance process: Rose & Associates Risk Coordinators Workshop No. 1, Houston, Texas, September 16, 2008, accessed September 6, 2022, https://www.roseassoc.com/wp-content/uploads/2021/07/Bond-2008-RCW_BG-Assurance-Process.pdf.
Boyd, B., 2019, Anadarko petroleum exploration lookback 2004-18: Lessons learned for conventional exploration risk and uncertainty predictions: Houston Geological Society Monthly Meeting, Houston, Texas, September 18, 2019, accessed February 3, 2020, https://www.roseassoc.com/wp-content/uploads/2021/02/Boyd-2019-Anadarko-approved.pdf.
Capen, E. C., 1976, The difficulty of assessing uncertainty: Journal of Petroleum Technology, v. 28, no. 8, p. 843–850, doi:10.2118/5579-PA.
Citron, G. P., 2021, Performance tracking: A historical background to promote learning: AAPG Bulletin, v. 105, no. 4, p. 639–645, doi:10.1306/08122019276.
Citron, G. P., M. Bond, and P. Carragher, 2017, Exploration assurance team best practices: AAPG Search and Discovery article 70264, accessed August 9, 2019, http://www.searchanddiscovery.com/documents/2017/70264citron/ndx_citron.pdf.
Harper, F., 2000, Prediction accuracy in petroleum prospect assessment: A 15-year retrospective in BP, in K. Ofstad, J. E. Kittilsen, and P. Alexander-Marrack, eds., Improving the exploration process by learning from the past: Amsterdam, Elsevier, Norwegian Petroleum Society Special Publication 9, p. 15–21., doi:10.1016/S0928-8937(00)80005-3.
Hart, T., 1988, The future of domestic exploration, Houston Geological Society Monthly Meeting, Houston, Texas, October 26, 1988, accessed July 16, 2022, https://www.roseassoc.com/wp-content/uploads/2022/07/The-Future-of-Domestic-Exploration-by-TF-Hart.pdf.
Kahneman, D., 2011, Thinking, fast and slow: New York, Farrar, Straus & Giroux, 499 p.
Kahneman, D., O. Sibony, and C. R. Sunstein, 2021, Noise: A flaw in human judgment: New York, Little, Brown Spark, 464 p.
Latham, A., and D. Parkinson, 2013, Five pillars of exploration success: What makes a good explorer? 8 p., accessed November 13, 2018, https://studylib.net/doc/8869303/five-pillars-of-exploration-success.
MacKay, J., 1996, Risk management in international petroleum ventures: Ideas from a Hedberg Conference: AAPG Bulletin, v. 80, no. 12, p. 1845–1849, doi:10.1306/64EDA212-1724-11D7-8645000102C1865D.
McMaster, G., 1997, New trends in exploration risk analysis, accessed September 1, 2019, https://www.roseassoc.com/wp-content/uploads/2021/02/McMaster-1997-Amoco.pdf.
McMaster, G., 2008, Risk police: Evil naysayers or exploration best ![]() practice
practice![]() ?, accessed February 12, 2019, https://www.roseassoc.com/wp-content/uploads/2022/07/Risk-Police.pdf.
?, accessed February 12, 2019, https://www.roseassoc.com/wp-content/uploads/2022/07/Risk-Police.pdf.
McMaster, G., and P. Carragher, 2003, Fourteen years of risk assessment at Amoco and BP: A retrospective look at the processes and impact, 4 p., accessed October 4, 2022, https://old.cseg.ca/assets/files/resources/abstracts/2003/445S0203.pdf.
Merrow, E. W., 2012, Oil and gas industry megaprojects: Our recent track record: Oil and Gas Facilities, v. 1, no. 2, p. 38–42, doi:10.2118/153695-PA.
Milakovich, M., 1995, Improving service quality: Achieving high performance in the public and private sectors: Boca Raton, Florida, CRC Press, 280 p.
Milkov, A., 2017, Integrate instead of ignoring: Base rate neglect as a common fallacy of petroleum explorers: AAPG Bulletin, v. 101, no. 12, p. 1905–1916, doi:10.1306/0327171622817003.
Moeller, U., 2015, Prospect appraisal: Learning from past performance: Rose & Associates Risk Coordinators Workshop No. 7, Denver, Colorado, June 14, 2015, accessed July 12, 2019, https://www.roseassoc.com/wp-content/uploads/2021/02/Moeller-2015-Wintershall-approved.pdf.
Otis, R., and N. Schneidermann, 1997, A process for evaluating exploration prospects: AAPG Bulletin, v. 81, no. 7, p. 1087–1109, doi:10.1306/522B49F1-1727-11D7-8645000102C1865D.
Phoel, C. M., 2009, Feedback that works: Harvard Business Review, April 27, 2009, accessed August 13, 2020, http://hbr.org/2009/04/feedback-that-works.
Rose, P. R., 2001, The relation of corporate organizational and cultural patterns to exploration performance (abs.): AAPG Annual Convention, Denver, Colorado, June 3–6, 2001, accessed November 2, 2019, https://www.searchanddiscovery.com/abstracts/html/2001/annual/abstracts/0684.htm.
Rose, P. R., 2012, Risk analysis and management of petroleum exploration ventures: AAPG Methods in Exploration 12, CD-ROM, 164 p.
Rose, P. R., 2017, Evolution of E&P risk analysis (1960-2017): AAPG Search and Discovery article 42063, accessed September 9, 2019, http://www.searchanddiscovery.com/pdfz/documents/2017/42063rose/ndx_rose.pdf.html.
Rose, P. R., and G. P. Citron, 2000, The “prospector myth” versus systematic management of exploration portfolios: Dealing with the dilemma: Houston Geological Society Bulletin, v. 43, no. 2, p. 27, 29–30.
Rudolph, K. W., and F. J. Goulding, 2017, Benchmarking exploration predictions and performance using 20+ years of drilling results: One company’s experience: AAPG Bulletin, v. 101, no. 2, p. 161–176, doi:10.1306/06281616060.
Schneider, M., 2016, Do I need an engineer on my risk consistency team?: Rose & Associates Risk Coordinators Workshop 10, Tokyo, Japan, November 21–22, 2016, accessed January 3, 2019, https://www.roseassoc.com/wp-content/uploads/2021/02/Schneider-2016-Engineer-on-Assurance-Team.pdf.
Sluijk, D., and J. R. Parker, 1986, Comparison of predrilling predictions with postdrilling outcomes: Using Shell’s prospect appraisal system, in I. Rice, and D. Dudley, eds., Oil and gas assessment: Methods and applications: AAPG Studies in Geology 21, p. 55–58, doi:10.1306/St21460C5.
Søiland, G., 2019, YTF – Statistical analysis of 1700 prospects and leads: Stavanger, Norway, Norwegian Petroleum Directorate, 42 p., accessed January 21, 2021, https://www.npd.no/globalassets/2-force/2019/documents/archive-2010-2018/frontier-exploration-workshop/force-2017-play-modelling-npd.pdf.
Sykes, M. A., K. C. Hood, S. N. Salzman, and C. J. Vandewater, 2011, Say what we mean and mean what we say: The unified upstream risk model as a force for shared understanding: AAPG Search and Discovery article 701110, accessed January 30, 2021, http://www.searchanddiscovery.com/pdfz/documents/2011/70110sykes/ndx_sykes.pdf.html.
van Mastrigt, P., and M. Quinn, 2021, Reducing uncertainties to shape the future of exploration: International Petroleum Technology Conference, Virtual, March 23–April 1, 2021, IPTC-21339-MS, 10 p., doi:10.2523/IPTC-21339-MS.
Ward, G., and S. Whitaker, 2016, Common misconceptions in subsurface and surface risk analysis: 78th European Association of Geoscientists and Engineers Annual Technical Conference, May 30–June 2, 2016, SPE-180134-MS, 19 p., doi:10.2118/180134-MS.
AUTHORS
Marc Bond is a senior associate with Rose & Associates. He has 40 years’ international experience. Previously, he worked for BG Group, with roles including chief geophysicist and subsurface assurance manager. He manages the Rose & Associates Risk Coordinators workshops. He received his M.Sc. degree in geophysics from the Colorado School of Mines and his B.Sc. degree in geology from the University of California, Santa Cruz.
Gary P. Citron is a senior associate with Rose & Associates. In 2008, he cofounded the Rose & Associates Risk Coordinators Workshop, which continues today. From 1994 to 1998, he served on Amoco’s assurance team after various technical and managerial assignments. He received his B.S. degree in geology from the University at Buffalo, and his Ph.D. in geology from Cornell University.
Doug Weaver is a partner with Rose & Associates. He has held a variety of exploration staff and management positions with Chevron and Texaco, including Chevron’s assurance team. Along with Marc Bond, he coordinates the Rose & Associates risk coordinators workshops. He has a B.Sc. degree in engineering from the University of Illinois and is a licensed petroleum engineer.
ACKNOWLEDGMENTS
The authors are grateful to Peter Carragher, Jim Gouveia, Paul Haryott, Jim MacKay, Bob Otis, Peter Rose, Mark Schneider, Lisa Ward, Ray Young (all with Rose & Associates), and Graeme Bagley (Westwood Global Energy Group) for their contributions. For more than a decade, over 60 assurance practitioners and members of the Rose & Associates Risk Coordinators Network have shared both successes and challenges as they establish and ![]() practice
practice![]() sound assurance. Their openness and honesty helped shape this paper. The authors also thank the anonymous AAPG reviewers for their constructive comments and feedback.
sound assurance. Their openness and honesty helped shape this paper. The authors also thank the anonymous AAPG reviewers for their constructive comments and feedback.
APPENDIX: THE CURRENT STATE OF ASSURANCE TEAM CHARACTERISTICS AND PRACTICES
A 2019 survey of assurance practitioners (called the Risk Coordinators Network) provided a recent snapshot of how companies design and implement assurance. Thirty-six international E&P companies of varying size, including government agencies, took part. Figure 7 summarizes the results. The most revealing outcome was that the pre- versus postwell analyses conducted by assurance teams were not always shared with the technical staff, impeding future improvement.
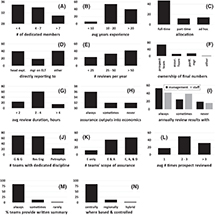 Figure 7. For each of the plots, the y axis is the percentage of the assurance teams that selected a certain x axis category. In plot (J) (see Appendix), teams can have multiple selections, and the sum will exceed 100%. The full questions follow the plots. A = appraisal; Assur. = assurance; avg = average; D = development; E = exploration; ELT = exploration leadership team; expl. = explorer; G & G = geology and geophysics; Petrophys. = petrophysical; port. mgr. = portfolio manager; Res Eng = research engineering.
Survey responses identified the top five areas in assurance working well, and the top five areas for improvement are as follows.

The fully stated survey questions (letter in parentheses refers to the respective plot) follow.
(A) How many dedicated members are currently assigned to the team?
(B) What is the average experience level of the team?
(C) What percentage of the dedicated team members are full-time, part-time, or ad hoc?
(D) To whom does the lead of your assurance team report?
(E) Approximately how many reviews per year do you hold?
(F) Who has ownership of the final assurance numbers?
(G) On average (during the past 12 months), how long are assurance reviews?
(H) Does the assurance team have direct input into the economics and commercial applications of the assured opportunity?
(I) Do you provide an annual review of the compiled postwell analysis results and learnings to management?
(J) What are the disciplines of the various dedicated team members?
(K) What is the scope of your assurance team? E = Exploration, A = Appraisal, D = Development
(L) How many times on average (during the past 12 months) do you review an opportunity in advance of the presentation for authorization?
(M) Do you provide written summary notes postreview?
(N) Is your assurance team centrally or regionally based (or a hybrid of the two)?