The AAPG/Datapages Combined Publications Database
Environmental Geosciences (DEG)
Full Text
![]() Click to view page images in PDF format.
Click to view page images in PDF format.
Environmental Geosciences, V.
DOI: 10.1306/eg.07071717001
High-resolution satellite imagery applied to monitoring revegetation of oil-sands-exploration well pads
Cynthia K. Dacre,1 David A. Palandro,2 Anna Oldak,3 Alex W. Ireland,4 and Sean M. Mercer5
1Radiant Solutions, 820 W Diamond Avenue, Gaithersburg, Maryland 20878; [email protected]
2ExxonMobil Upstream Research Company, 22777 Springwoods Village Parkway, Spring, Texas 77389; [email protected]
3[email protected]
4ExxonMobil Biomedical Sciences, Inc., 1545 US Highway 22 East, Annandale, New Jersey 08801; [email protected]
5Imperial Oil Limited–Sarnia Technology Applications & Research, 453 Christina Street S., Sarnia, Ontario N7T 8C8, Canada; [email protected]
ABSTRACT
To achieve reclamation certification, oil-and-gas operations in Alberta, Canada are required to monitor the revegetation of idle well pads that no longer support operations. Currently, monitoring is completed by oblique, helicopter-collected photography and on-the-ground field surveys. Both monitoring strategies present safety and logistical challenges. To mitigate these challenges, a remote-sensing project was completed to develop and deploy a reproducible workflow using high-spatial-resolution satellite imagery to monitor revegetation progress on idle well pads. Seven well pads in the Aspen region of Alberta, Canada were selected for workflow development, using imagery from 2007, 2009, and 2011. ![]() Land
Land![]() -cover classes were derived from the satellite imagery using a training dataset, a series of vegetation indices derived from the satellite imagery, and regression tree classification programs, and were used to evaluate changes in vegetation cover over time. A refined version of this general workflow was then deployed across 39 well pads in the Firebag region of Alberta, Canada, using imagery from 2010 to 2016. In 2016, fieldwork was conducted across a subset of 16 well pads in the Firebag region, which facilitated a formal accuracy assessment of the
-cover classes were derived from the satellite imagery using a training dataset, a series of vegetation indices derived from the satellite imagery, and regression tree classification programs, and were used to evaluate changes in vegetation cover over time. A refined version of this general workflow was then deployed across 39 well pads in the Firebag region of Alberta, Canada, using imagery from 2010 to 2016. In 2016, fieldwork was conducted across a subset of 16 well pads in the Firebag region, which facilitated a formal accuracy assessment of the ![]() land
land![]() -cover classifications. This project demonstrated that high-spatial-resolution satellite imagery could be used to develop accurate
-cover classifications. This project demonstrated that high-spatial-resolution satellite imagery could be used to develop accurate ![]() land
land![]() -cover classifications on these relatively small landscape features and that temporal
-cover classifications on these relatively small landscape features and that temporal ![]() land
land![]() -cover classifications could be used to track revegetation through time. Overall, these results show the feasibility of remote-sensing–based workflows in monitoring revegetation on idle well pads.
-cover classifications could be used to track revegetation through time. Overall, these results show the feasibility of remote-sensing–based workflows in monitoring revegetation on idle well pads.
INTRODUCTION AND BACKGROUND
The province of Alberta holds one of the largest crude-oil resources in the world and the energy industry is the largest contributor to the provincial economy. However, oil-and-gas development in boreal ecosystems requires substantial postoperation reclamation. Alberta’s ![]() land
land![]() -reclamation program for the upstream oil-and-gas industry is managed by the Alberta Energy Regulator (AER) as directed under the Environmental Protection and Enhancement Act and the Conservation and Reclamation Regulation (Alberta Energy Regulator, 2016). As of 2013, there were approximately 100,000 reclaimed well pads across the province, 60,000 well pads classified as “abandoned but not reclaimed,” and an additional 430,000 well pads that were drilled but had not yet been designated as either formally abandoned or reclaimed (Alberta Environment and Sustainable Resource Development, 2014). The fundamental requirement for reclamation certification is that disturbed
-reclamation program for the upstream oil-and-gas industry is managed by the Alberta Energy Regulator (AER) as directed under the Environmental Protection and Enhancement Act and the Conservation and Reclamation Regulation (Alberta Energy Regulator, 2016). As of 2013, there were approximately 100,000 reclaimed well pads across the province, 60,000 well pads classified as “abandoned but not reclaimed,” and an additional 430,000 well pads that were drilled but had not yet been designated as either formally abandoned or reclaimed (Alberta Environment and Sustainable Resource Development, 2014). The fundamental requirement for reclamation certification is that disturbed ![]() land
land![]() be returned to an ecological condition functionally similar, but not necessarily identical, to predisturbance conditions (Alberta Energy Regulator, 2016).
be returned to an ecological condition functionally similar, but not necessarily identical, to predisturbance conditions (Alberta Energy Regulator, 2016).
One component of Alberta’s reclamation program concerning oil-sands-exploration (OSE) well pads is the requirement for monitoring of idle well pads to provide information on revegetation trajectory in support of eventual reclamation certification (Alberta Energy Regulator, 2014). At present, most monitoring events on these remote sites are completed by oblique, helicopter-collected photography and on-the-ground field surveys, both of which present safety concerns and logistical challenges. Regulatory guidance (Alberta Energy Regulator, 2016) specifies that, prior to submitting an application for a reclamation certificate, a well-pad operator must perform an onsite environmental assessment to collect data demonstrating the condition of the landscape (i.e., topographic features), soils, and vegetation. The vegetation part of this assessment includes an evaluation of the type, extent of coverage, and vigor of regrowth on the well pad and surrounding area.
Given the remote and challenging environment of oil-and-gas exploration areas in northern Alberta, safety and logistical challenges are inherent to monitoring efforts. However, the spatial scale of the current helicopter and on-the-ground monitoring activities on these well-pad sites is compatible with current high-spatial-resolution satellite imagery. Application of remote-sensing technologies could represent a substantial process improvement, streamlining reclamation monitoring, while simultaneously reducing safety risks. The availability of commercial, satellite-derived, high-spatial-resolution image data has increased significantly over the past decade, with various commercial multispectral sensors having spatial resolutions of less than 2 m (7 ft), and pan-sharpened imagery having spatial resolution down to 0.3 m (1 ft).
Although this wealth of satellite data opens new doors for environmental monitoring, consistent interpretation of this imagery can be challenging in heterogeneous settings such as boreal forests. Research efforts have gone toward development of methodologies to address these challenges, using medium-spatial-resolution optical-satellite sensors. For example, Powers et al. (2013) used 30-m (98-ft) spatial-resolution Landsat data for a biodiversity assessment in the Canadian boreal forest. Alberta Ground Cover Characterization, an initiative between the University of Alberta and partners in the provincial and federal government, completed ![]() land
land![]() -cover maps derived from Landsat (Sánchez-Azofeifa et al., 2005). In addition, the Alberta government has supported the Alberta Terrestrial Imaging Centre at the University of Lethbridge in efforts to create a plan to use remote sensing to assess multiple aspects of disturbed-
-cover maps derived from Landsat (Sánchez-Azofeifa et al., 2005). In addition, the Alberta government has supported the Alberta Terrestrial Imaging Centre at the University of Lethbridge in efforts to create a plan to use remote sensing to assess multiple aspects of disturbed-![]() land
land![]() restoration (Rochdi, 2012; Rochdi et al., 2014). Rochdi (2012) used variable-spatial-resolution (5–30 m [16–98 ft]) satellite imagery over several sites to map
restoration (Rochdi, 2012; Rochdi et al., 2014). Rochdi (2012) used variable-spatial-resolution (5–30 m [16–98 ft]) satellite imagery over several sites to map ![]() land
land![]() cover and
cover and ![]() land
land![]() -cover change. However, concerted efforts to leverage newly available high-spatial-resolution satellite images to assess
-cover change. However, concerted efforts to leverage newly available high-spatial-resolution satellite images to assess ![]() land
land![]() -cover changes within small disturbed areas have been limited to date.
-cover changes within small disturbed areas have been limited to date.
This paper describes the development and deployment of methods using high-spatial-resolution imagery to classify ![]() land
land![]() cover and to track vegetation change through time on small OSE well pads (∼0.04 ha [∼0.10 ac]) within a boreal-forest matrix. This project focused on two primary objectives. The 1st objective was to develop methodology to detect ecologically relevant
cover and to track vegetation change through time on small OSE well pads (∼0.04 ha [∼0.10 ac]) within a boreal-forest matrix. This project focused on two primary objectives. The 1st objective was to develop methodology to detect ecologically relevant ![]() land
land![]() cover from high-spatial-resolution satellite imagery. The 2nd objective was to test implementation of the developed workflow on a larger set of well pads to estimate
cover from high-spatial-resolution satellite imagery. The 2nd objective was to test implementation of the developed workflow on a larger set of well pads to estimate ![]() land
land![]() -cover change over time and identify whether adjustments were needed. Areas of interest (AOIs) containing OSE well pads that will eventually require reclamation certification were selected from within the Aspen field and the Firebag field in the Athabasca oil-sands region (Figure 1).
-cover change over time and identify whether adjustments were needed. Areas of interest (AOIs) containing OSE well pads that will eventually require reclamation certification were selected from within the Aspen field and the Firebag field in the Athabasca oil-sands region (Figure 1).
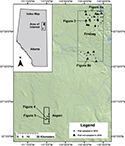 Figure 1. An overview map depicting the location of the Aspen and Firebag areas of interest within the province of Alberta and the locations of individual well pads studied within each area of interest. The 16 well pads marked with triangles were field sampled in 2016 for an accuracy assessment of classification results. Individual well pads presented in subsequent figures are noted.
SITE DESCRIPTION
The Aspen and Firebag AOIs fall within the Central Mixedwood Natural Subregion of the Alberta Boreal Forest (Natural Regions Committee, 2006). Climatic normals (1981–2010) from Fort McMurray (station identifier: 3062693) indicate a mean annual daily temperature of 1°C (34°F), mean annual rainfall of 316 mm (12 in.), and mean annual snowfall of 1338 mm (53 in.). The Aspen AOI lies within the Saskatchewan Plains physiographic region and the Muskeg Ecodistrict (Smith et al., 1979; Natural Regions Committee, 2006). The Firebag AOI lies in the Northern Alberta Lowlands physiographic region and the Hart Lake Ecodistrict (Natural Regions Committee, 2006). Surficial geology in both AOIs is characterized by heterogeneous materials of mixed origins and textures, forming relatively flat to undulating topography (Natural Regions Committee, 2006). The Aspen AOI holds variable thicknesses of organic soils overlying glacial moraine and glaciofluvial sediments (Atkinson et al., 2014). These unconsolidated deposits in turn overlie sedimentary rocks of the Lower Cretaceous Grand Rapids Formation (Prior et al., 2013). The Firebag AOI holds organic soils overlying fluted moraines and local meltwater channels and crevasse fills, which rest upon the McMurray Formation (Fenton et al., 2013; Atkinson et al., 2014) consisting of Lower Cretaceous bituminous sandstones and shale (Prior et al., 2013).
Across both AOIs, upland areas are dominated by forests (Natural Regions Committee, 2006). Upland forests are commonly closed-canopy with aspen (Populus tremuloides) dominant in early successional stages and white spruce (Picea glauca) abundance increasing as stands age. Common understory species include low-bush cranberry (Viburnum edule), prickly rose (Rosa acicularis), green alder (Alnus viridis), beaked hazelnut (Corylus cornuta), and Canada buffaloberry (Shepherdia canadensis). Common herbaceous species include wild sarsaparilla (Aralia nudicaulis), cream-colored vetchling (Lathyrus ochroleucus), showy aster (Eurybia conspicua), tall lungwort (Mertensia paniculata), and hairy wild rye (Leymus innovatus). Jack pine stands are common on coarse-textured substrate, often with bearberry (Arctostaphylos uva-ursi) and Vaccinium species in the understory. In the absence of disturbance, grasslands are relatively rare. Where grass species do occur, northern rice grass (Oryzopsis pungens), Rocky Mountain fescue (Festuca saximontana), dryland sedges (Carex xerantica), and plains wormwood (Artemisia campestris) are most prevalent (Natural Regions Committee, 2006). Wetland ecosystems are also important components of this landscape, with peat-accumulating fens and bogs (peatland) dominated by Sphagnum mosses, black spruce, ericaceous shrubs, and sedges occupying as much as 40% of the ![]() land
land![]() area (Vitt et al., 1996; Graf, 2009).
area (Vitt et al., 1996; Graf, 2009).
The Aspen AOI contains seven idle OSE well pads located within a 10-km2 (4-mi2) area. Reclamation of these pads began in mid-2007. However, one pad was disturbed again between 2007 and 2009 by linear vegetation removal for seismic ![]() acquisition
acquisition![]() . The Firebag AOI contains 39 OSE well pads located within a 1500-km2 (580-mi2) area. These well pads were cleared in 2010 and fall into a northern and a southern cluster (Figure 1).
. The Firebag AOI contains 39 OSE well pads located within a 1500-km2 (580-mi2) area. These well pads were cleared in 2010 and fall into a northern and a southern cluster (Figure 1).
METHODOLOGY OVERVIEW
This project was completed between 2014 and 2016. Given the scope and duration of the work, it was assumed from the outset that there could be challenges related to availability of consistent imagery and software development through time. Thus, methods were selected to assess and, if needed, minimize potential inconsistencies associated with (1) different sensors, (2) different bands, (3) imagery acquired from times within the growing season, (4) different ![]() acquisition
acquisition![]() parameters (e.g., off-nadir and sun-elevation angles), and (5) evolution in image processing and analysis tools. Detailed methods and methodological evolution are described in subsequent paragraphs, but the general project progression was as follows. In 2014, the Aspen AOI was used to develop a workflow to classify
parameters (e.g., off-nadir and sun-elevation angles), and (5) evolution in image processing and analysis tools. Detailed methods and methodological evolution are described in subsequent paragraphs, but the general project progression was as follows. In 2014, the Aspen AOI was used to develop a workflow to classify ![]() land
land![]() cover on seven OSE well pads and 250-m (820-ft) buffer zones around the pads using high-spatial-resolution satellite images collected in 2007, 2009, and 2011. Visual assessment of results was performed using oblique images collected during helicopter overflights conducted in 2011.
cover on seven OSE well pads and 250-m (820-ft) buffer zones around the pads using high-spatial-resolution satellite images collected in 2007, 2009, and 2011. Visual assessment of results was performed using oblique images collected during helicopter overflights conducted in 2011. ![]() Land
Land![]() -cover classifications were then used to track the progress of revegetation. In 2015, this workflow was deployed over 39 OSE well pads in the Firebag AOI. The
-cover classifications were then used to track the progress of revegetation. In 2015, this workflow was deployed over 39 OSE well pads in the Firebag AOI. The ![]() land
land![]() -cover classes used at the Firebag AOI were refined based on the results of the Aspen AOI work. High-spatial-resolution satellite images were collected over the Firebag AOI in 2010, 2012, and 2015 and used to perform
-cover classes used at the Firebag AOI were refined based on the results of the Aspen AOI work. High-spatial-resolution satellite images were collected over the Firebag AOI in 2010, 2012, and 2015 and used to perform ![]() land
land![]() -cover classifications. These classification results were again compared to oblique images collected via helicopter overflights conducted in 2015 to visually assess classification accuracy. A ground-truth campaign was conducted in the Firebag AOI in 2016. Field data drove further refinement of classes and a modification of the on-pad classification methods. This refined methodology was then applied to the 2010, 2012, and 2015 imagery collected over the Firebag AOI and to additional images collected in 2011, 2013, 2014, and 2016 to achieve annual resolution. Ground-truth data were used to perform a formal accuracy assessment on classifications from 2016.
-cover classifications. These classification results were again compared to oblique images collected via helicopter overflights conducted in 2015 to visually assess classification accuracy. A ground-truth campaign was conducted in the Firebag AOI in 2016. Field data drove further refinement of classes and a modification of the on-pad classification methods. This refined methodology was then applied to the 2010, 2012, and 2015 imagery collected over the Firebag AOI and to additional images collected in 2011, 2013, 2014, and 2016 to achieve annual resolution. Ground-truth data were used to perform a formal accuracy assessment on classifications from 2016.
REMOTE-SENSING METHODS
Image  Acquisition
 , Preparation, and Orthorectification
Technical specifications for satellite images used in this project are summarized in Table 1. All imagery and geographic information system (GIS) files were projected in UTM 12N, using the WGS84 datum. Imagery used for workflow development over the Aspen AOI included QuickBird-2 (QB2) images from 2007, 2009, and 2011; as well as WorldView-2 (WV2) images from 2011 to 2013 (Table 2). Imagery used for workflow deployment over the Firebag AOI included QB2 images from 2010; GeoEye images from 2011; Pleiades images from 2012, 2013, and 2014; WV2 images from 2015 to 2016; and WorldView-3 (WV3) images from 2015 to 2016.


The raw satellite data were converted to radiance and corrected to at-satellite reflectance. Firebag data were subsequently converted to surface reflectance (Figure 2) (Huguenin et al., 2013). For the Aspen AOI, processes following US Geological Survey (USGS) procedure for top-of-atmosphere correction (as described in US Geological Survey [2017]) and specific parameters for QB2 and WV2 imagery (Updike and Comp, 2010; Podger et al., 2011; Kuester, 2016) were used. For the Firebag AOI, IMAGINE AAICTM, supplied by Applied Analysis Inc., was used to correct imagery to surface reflectance for all imagery except WV3. Information required to correct WV3 imagery was not available at the time of image ![]() acquisition
acquisition![]() , so those images were corrected to surface reflectance by Digital Globe using proprietary software prior to delivery to the research team.
, so those images were corrected to surface reflectance by Digital Globe using proprietary software prior to delivery to the research team.
 Figure 2. Schematic diagram of workflow used in this project. Raw satellite imagery was first converted from digital number to surface reflectance. Coregistration generated spatially aligned time-series imagery. Segmentation is an optional step, the appropriateness of which will vary depending on heterogeneity of study areas. Similarly, the method of classification may vary. For the final workflow deployment of this project, wetland determinations were made using ancillary data outside of the spectrally based classification workflow.
Consistent, precise, image orthorectification is a challenge in settings like these AOIs because detailed digital-elevation models (DEMs) may not be available, the topography is often fairly flat, and there is often a paucity of stable reference points definitively identifiable on imagery. To control for spatial offsets in images collected at different times, primary images were selected from each geographic region for orthorectification and all overlapping images were coregistered to their corresponding primary image using ground-control points. All coregistered multispectral scenes were resampled to 2 m (7 ft) using nearest-neighbor transformation and snapped to the orthorectified pixel grid. For workflow development over the Aspen AOI, the August 11, 2011 QB2 image (Table 2) was orthorectified using 90 m (295 ft) horizontal-resolution Canada Digital Elevation Data. Higher-resolution topographic data were available for workflow deployment over the Firebag AOI. A hybrid DEM was created covering the whole AOI by mosaicing a 15-m (49-ft) resolution LIDAR-derived DEM available over a part of Firebag with 30-m (98-ft) resolution Shuttle Radar Topography Mission (SRTM) DEM covering the rest of the region. This hybrid DEM was used to orthorectify the May 24, 2016 WV2 (Table 2) image over the northern part of the Firebag AOI and the June 7, 2016 WV3 image (Table 2) over the southern part of the Firebag AOI. Satellite images were pan-sharpened for visualization purposes, but all spectral analyses were performed on the multispectral data at the native spatial resolution.
Land-Cover Classification
For this project, a supervised classification approach was used, requiring the following basic steps and decisions: (1) selection of a classification scheme, (2) selection between the application of a segmentation routine or a pixel-by-pixel classification approach, (3) selection of bands and derived indices to use within analyses, (4) ![]() acquisition
acquisition![]() of training data, (5) choice and application of a classification program, (6) postprocessing quality assurance, and (7) further analyses. These steps are described in the subsequent paragraphs.
of training data, (5) choice and application of a classification program, (6) postprocessing quality assurance, and (7) further analyses. These steps are described in the subsequent paragraphs.
A modified Anderson Classification Scheme (Anderson et al., 1976) was selected, with minor revisions made as the project evolved and new information became available (Table 3). During workflow development over the Aspen AOI in 2014, it was observed that nonvegetated areas on well pads displayed two spectrally distinct subclasses, which were separated and referred to as “barren” and “other nonvegetated.” Classifications performed over the Aspen AOI also included a spectrally based herbaceous wetland class. In 2015, the “other nonvegetated” class was removed for classifications performed over the Firebag AOI because the ![]() land
land![]() cover that it represented was not fully understood, leading to challenges in interpretation. Fieldwork in 2016 led to two additional refinements. First, substantial variability in percentage of vegetation cover was observed on “scrub/shrub”-dominated pads, leading to inclusion of an “incipient scrub/shrub” class for areas that were generally “scrub/shrub” dominated, but with visible ground and vegetation cover ranging from 10% to 90%. Second, the “herbaceous wetland” class was found to be inadequate because it failed to capture shrub- and tree-dominated peatlands, which are common in the boreal forest (Vitt et al., 1996). Thus, wetland categories were removed from the spectrally based classification scheme. Wetland determinations were performed postclassification using the Alberta Merged Wetland Inventory GIS files (Alberta Environment and Parks, 2017). This approach allowed for detection of shrub-, tree-, and/or herbaceous-dominated wetlands.
cover that it represented was not fully understood, leading to challenges in interpretation. Fieldwork in 2016 led to two additional refinements. First, substantial variability in percentage of vegetation cover was observed on “scrub/shrub”-dominated pads, leading to inclusion of an “incipient scrub/shrub” class for areas that were generally “scrub/shrub” dominated, but with visible ground and vegetation cover ranging from 10% to 90%. Second, the “herbaceous wetland” class was found to be inadequate because it failed to capture shrub- and tree-dominated peatlands, which are common in the boreal forest (Vitt et al., 1996). Thus, wetland categories were removed from the spectrally based classification scheme. Wetland determinations were performed postclassification using the Alberta Merged Wetland Inventory GIS files (Alberta Environment and Parks, 2017). This approach allowed for detection of shrub-, tree-, and/or herbaceous-dominated wetlands.
Segmentation procedures are used to subdivide images into polygons of contiguous, spectrally similar areas prior to classification. Segmentation can be especially useful in forested areas where tree shadows can complicate classifications (Ozdemir, 2008). During workflow development over the Aspen AOI in 2014, segmentation was applied across whole images, including well pads and buffer zones, using lambda-schedule segmentation, which accepts all image bands as inputs (Robinson et al., 2002). By 2015, a superior segmentation algorithm, Segment Mean Shift (SMS), was available within ArcMap 10.3 and this segmentation routine was applied during the 1st phase of workflow deployment over the Firebag AOI. Segment Mean Shift provides excellent results in clustering and object delineation (Boukir et al., 2012), but only accepts three bands. To provide maximum image information in three bands, Tasseled Cap (TC) transformations (Kauth and Thomas, 1976) were performed on the QB2, WV2, and WV3 image surface-reflectance data. Tasseled Cap transformations reorganize the original image bands into components with defined interpretations useful for vegetation mapping. The coefficients used to create the TC bands are derived from each sensor and statistically from within the image data. Because TC transformations are not available for Pleiades imagery, a three-band composite (near infrared [NIR], red, and green bands) was used with SMS to segment the Firebag Pleiades images. However, 2016 fieldwork in the Firebag AOI documented substantial heterogeneity on well pads that could potentially be masked through application of segmentation processes prior to classification. Thus, for the final workflow deployment over the Firebag AOI in 2016, well pads were classified using a pixel-by-pixel approach, with segmentation applied only in the buffer zones that were predominantly forested, homogenous, and more subject to tree-shadow effects.
Because the goal of this project was to develop high-spatial-resolution classifications and assess the progress of revegetation over recently disturbed OSE well pads, a series of derived vegetation indices was calculated and used as inputs for classification. Formulas and associated references for the vegetation indices used in this project are summarized in Table 4. These derived indices were used in conjunction with the reflectance bands in the classifications.

Training data were visually selected on a per-pixel basis to represent each ![]() land
land![]() -cover class. For all images at both the Aspen AOI and the Firebag AOI, training pixels were selected by an experienced interpreter, using the image data as reference. In addition, oblique, helicopter-collected photographs were used to guide identification of the training pixels. Oblique helicopter-collected images were collected over the Aspen AOI in 2011 and over the Firebag AOI in 2015.
-cover class. For all images at both the Aspen AOI and the Firebag AOI, training pixels were selected by an experienced interpreter, using the image data as reference. In addition, oblique, helicopter-collected photographs were used to guide identification of the training pixels. Oblique helicopter-collected images were collected over the Aspen AOI in 2011 and over the Firebag AOI in 2015.
Regression tree classification was used to create ![]() land
land![]() -cover maps. Regression tree classification is a flexible, nonparametric, and automated data-mining approach for classifying with multiple sets of independent variables, including ancillary data if available (Smith et al., 2004). For workflow development over the Aspen AOI, segmented images, reflectance bands, vegetation indices, and training pixels were combined to perform the classification using the National
-cover maps. Regression tree classification is a flexible, nonparametric, and automated data-mining approach for classifying with multiple sets of independent variables, including ancillary data if available (Smith et al., 2004). For workflow development over the Aspen AOI, segmented images, reflectance bands, vegetation indices, and training pixels were combined to perform the classification using the National ![]() Land
Land![]() -Cover Database (NLCD) tool distributed by the US Geological Survey (US Geological Survey, 2015). For the final workflow deployment over the Firebag AOI, the Maximum Likelihood Classifier in ArcMap 10.3 was used and segmentation was only applied to the buffer zones.
-Cover Database (NLCD) tool distributed by the US Geological Survey (US Geological Survey, 2015). For the final workflow deployment over the Firebag AOI, the Maximum Likelihood Classifier in ArcMap 10.3 was used and segmentation was only applied to the buffer zones.
Visual-Accuracy Assessment
The satellite-derived ![]() land
land![]() -cover results were evaluated for accuracy, consistency, and the ability to estimate revegetation progress over time. As these sites are remote and only accessible via helicopter during a brief seasonal window, well-defined ground-truth data were lacking during workflow development over the Aspen AOI in 2014 and the initial phase of workflow deployment over the Firebag AOI in 2015. Thus, a visual (qualitative) accuracy assessment was performed using 2011 helicopter-collected photography for each Aspen AOI well pad and 2015 helicopter-collected photography for each Firebag AOI well pad.
-cover results were evaluated for accuracy, consistency, and the ability to estimate revegetation progress over time. As these sites are remote and only accessible via helicopter during a brief seasonal window, well-defined ground-truth data were lacking during workflow development over the Aspen AOI in 2014 and the initial phase of workflow deployment over the Firebag AOI in 2015. Thus, a visual (qualitative) accuracy assessment was performed using 2011 helicopter-collected photography for each Aspen AOI well pad and 2015 helicopter-collected photography for each Firebag AOI well pad. ![]() Land
Land![]() -cover classification consistency between sensors was evaluated by comparing the Aspen AOI 2011 QB2-derived
-cover classification consistency between sensors was evaluated by comparing the Aspen AOI 2011 QB2-derived ![]() land
land![]() -cover results with the 2011 WV2-derived
-cover results with the 2011 WV2-derived ![]() land
land![]() -cover results. In addition, the classification results from each of these images were overlain to identify areas where results were inconsistent.
-cover results. In addition, the classification results from each of these images were overlain to identify areas where results were inconsistent.
GROUND-TRUTH METHODS
Field Methods
In August 2016, a subset of Firebag well pads (N = 16) was accessed by helicopter for field sampling (Figure 1). Sampled well pads were selected to capture the geographic and ![]() land
land![]() -cover variability of the broader set of well pads subjected to remote-sensing analyses. On each well pad, a stratified random-sampling scheme used the following procedures. First,
-cover variability of the broader set of well pads subjected to remote-sensing analyses. On each well pad, a stratified random-sampling scheme used the following procedures. First, ![]() land
land![]() cover was visually assessed to (1) determine the number of
cover was visually assessed to (1) determine the number of ![]() land
land![]() -cover types present and (2) estimate the proportion of the total well pad occupied by each
-cover types present and (2) estimate the proportion of the total well pad occupied by each ![]() land
land![]() -cover type. Sampling locations were then placed at random, well within each
-cover type. Sampling locations were then placed at random, well within each ![]() land
land![]() cover, while ensuring that sampling locations were within homogenous
cover, while ensuring that sampling locations were within homogenous ![]() land
land![]() -cover patches with buffers of greater than or equal to 2 m (7 ft) on all sides. Buffers were ensured in an effort to reduce errors associated with uncertainty in global positional system (GPS) locations. The fraction of total sampling locations placed within a given
-cover patches with buffers of greater than or equal to 2 m (7 ft) on all sides. Buffers were ensured in an effort to reduce errors associated with uncertainty in global positional system (GPS) locations. The fraction of total sampling locations placed within a given ![]() land
land![]() cover was scaled with the proportion of the well pad occupied by that particular
cover was scaled with the proportion of the well pad occupied by that particular ![]() land
land![]() cover (i.e., stratified). Because airborne operations were conducted in coordination with tree-planting efforts, the total amount of time spent on each well pad varied, resulting in a variable number of total sampling locations for each pad (6–30 samples, mean = 13). Additionally, one to four off-pad sampling points were placed in representative vegetation to ground-truth buffer zones, which were predominantly forested.
cover (i.e., stratified). Because airborne operations were conducted in coordination with tree-planting efforts, the total amount of time spent on each well pad varied, resulting in a variable number of total sampling locations for each pad (6–30 samples, mean = 13). Additionally, one to four off-pad sampling points were placed in representative vegetation to ground-truth buffer zones, which were predominantly forested.
At each sampling location, a 4-m2 (43-ft2) cross-type sampling quadrat was placed on the ground (Figure 3). Within each quadrat, the dominant and secondary/subdominant ![]() land
land![]() -cover classes were determined. Supplemental ecological and geomorphological data were also collected, including dominant plant taxa, plant height, landform, soil texture, and wetland status to aid in subsequent interpretation of the accuracy assessment. Additionally, six images were collected at each sampling location, following a consistent collection pattern, and were geographically stored with the point feature associated with the sampling location (Figure 3). All data, images, and GPS locations were collected using a custom-built data model for the Collector application for ArcGIS with three iPad Air devices. Accuracy tolerance was set such that points would not be collected if accuracy was greater than 9 m (30 ft).
-cover classes were determined. Supplemental ecological and geomorphological data were also collected, including dominant plant taxa, plant height, landform, soil texture, and wetland status to aid in subsequent interpretation of the accuracy assessment. Additionally, six images were collected at each sampling location, following a consistent collection pattern, and were geographically stored with the point feature associated with the sampling location (Figure 3). All data, images, and GPS locations were collected using a custom-built data model for the Collector application for ArcGIS with three iPad Air devices. Accuracy tolerance was set such that points would not be collected if accuracy was greater than 9 m (30 ft).
 Figure 3. Illustration of field-sampling methods. (A) A hypothetical oil-sands-exploration (OSE) well pad with two distinct
 ![]() land
land![]() covers, LC1 and LC2, occupying ∼30% and ∼70% of the total area, respectively. In this example, 10 sampling locations were placed. Sampling locations were proportionately divided among
covers, LC1 and LC2, occupying ∼30% and ∼70% of the total area, respectively. In this example, 10 sampling locations were placed. Sampling locations were proportionately divided among ![]() land
land![]() covers and then randomly placed within each
covers and then randomly placed within each ![]() land
land![]() cover. At each sampling location, a 2-m (7-ft) quadrat was placed (B). In addition to categorical data, six images were collected looking straight down at the center point (1), slightly up to the north (2), east (3), south (4), west (5), and a heads-up view to the north (6). (C) An example of a downward-looking image. (D) An example of a heads-up image. Note that these particular images capture “incipient scrub/shrub” in the field.
cover. At each sampling location, a 2-m (7-ft) quadrat was placed (B). In addition to categorical data, six images were collected looking straight down at the center point (1), slightly up to the north (2), east (3), south (4), west (5), and a heads-up view to the north (6). (C) An example of a downward-looking image. (D) An example of a heads-up image. Note that these particular images capture “incipient scrub/shrub” in the field.
Formal-Accuracy Assessment
To complete the accuracy assessment, field points were rasterized to create validation pixels, which were subsequently snapped to the center of the pixel in the 2016 ![]() land
land![]() -cover classification map. A spatially fuzzy intersection of the validation pixels with the 2016
-cover classification map. A spatially fuzzy intersection of the validation pixels with the 2016 ![]() land
land![]() -cover classification map was used to create an error matrix that accounted for spatial uncertainty in the GPS point-of-sampling locations by comparing the validation pixel with the pixel to which it was snapped and each of the eight nearest neighbor pixels (adjoining). If the field determination in the validation pixel matched the target pixel or any of the eight nearest neighbor pixels, it was considered to be a match. Results were exported to spreadsheet software for subsequent analyses. User and producer accuracy were calculated to express errors of omission (correct calls left out) and commission (calls were added that should not have been included), respectively. Accuracy was evaluated by calculating percent match, the Kappa coefficient (Congalton and Green, 2008), and the Tau coefficient, using the approach developed by Ma and Redmond (1995).
-cover classification map was used to create an error matrix that accounted for spatial uncertainty in the GPS point-of-sampling locations by comparing the validation pixel with the pixel to which it was snapped and each of the eight nearest neighbor pixels (adjoining). If the field determination in the validation pixel matched the target pixel or any of the eight nearest neighbor pixels, it was considered to be a match. Results were exported to spreadsheet software for subsequent analyses. User and producer accuracy were calculated to express errors of omission (correct calls left out) and commission (calls were added that should not have been included), respectively. Accuracy was evaluated by calculating percent match, the Kappa coefficient (Congalton and Green, 2008), and the Tau coefficient, using the approach developed by Ma and Redmond (1995).
REVEGETATION PROGRESS
The same straightforward approach to tracking revegetation progress was performed for both the Aspen AOI and the Firebag AOI. Within each classified well pad, the percentage of cover was calculated by class. Then, yearly means and standard deviations were calculated to assess AOI-level patterns in ![]() land
land![]() -cover change through time. Results are presented graphically.
-cover change through time. Results are presented graphically.
RESULTS
Aspen Area of Interest
Land-cover Classification and Visual-Accuracy Assessment
Helicopter-collected photographs, although qualitative, generally supported the ![]() land
land![]() -cover classification results (Figure 4). For example, small-scale features such as piping were visible in the helicopter images, observed in the WV2 satellite imagery, and successfully classified as “man-made” (Figure 4). Similarly, areas of “barren,” “grass,” and “forest, evergreen” are clearly identifiable in both the helicopter-collected photography and the satellite imagery as well as being correctly classified in the
-cover classification results (Figure 4). For example, small-scale features such as piping were visible in the helicopter images, observed in the WV2 satellite imagery, and successfully classified as “man-made” (Figure 4). Similarly, areas of “barren,” “grass,” and “forest, evergreen” are clearly identifiable in both the helicopter-collected photography and the satellite imagery as well as being correctly classified in the ![]() land
land![]() -cover analysis (Figure 4). However, careful examination of the helicopter-collected photography and satellite imagery also highlighted some potential challenges for accurate classification. As expected, boundaries are not always easily delineated between
-cover analysis (Figure 4). However, careful examination of the helicopter-collected photography and satellite imagery also highlighted some potential challenges for accurate classification. As expected, boundaries are not always easily delineated between ![]() land
land![]() -cover types. For example, the classification struggled to delineate boundaries within gradual transitions from one
-cover types. For example, the classification struggled to delineate boundaries within gradual transitions from one ![]() land
land![]() -cover class to another, especially “barren” to “grass.” The effect of areas of mixed vegetation type characteristics of different
-cover class to another, especially “barren” to “grass.” The effect of areas of mixed vegetation type characteristics of different ![]() land
land![]() -cover classes and assumed subpixel heterogeneity could also drive instances of misclassification. Sun angle and image
-cover classes and assumed subpixel heterogeneity could also drive instances of misclassification. Sun angle and image ![]() acquisition
acquisition![]() angle in places caused the projection of tall trees and tree shadows into the margins, which can complicate classification by altering detected spectral properties. Image
angle in places caused the projection of tall trees and tree shadows into the margins, which can complicate classification by altering detected spectral properties. Image ![]() acquisition
acquisition![]() angle can lead to marginal well pad areas being incorrectly classified as forest. The greater the off-nadir image
angle can lead to marginal well pad areas being incorrectly classified as forest. The greater the off-nadir image ![]() acquisition
acquisition![]() angle, the greater likelihood of pixel misclassification along the boundaries between different
angle, the greater likelihood of pixel misclassification along the boundaries between different ![]() land
land![]() covers.
covers.
 Figure 4. A comparison of a 2011 helicopter-collected image (A), WorldView-2 (WV2) imagery from 2011 (B; © 2011 DigitalGlobe, Inc.), and
 ![]() land
land![]() -cover results from the WV2 image (C) for well pad 12-24-93-7 within the Aspen area of interest (Figure 1). Legend is for
-cover results from the WV2 image (C) for well pad 12-24-93-7 within the Aspen area of interest (Figure 1). Legend is for ![]() land
land![]() cover provided in panel C.
cover provided in panel C.
The consistency of the ![]() land
land![]() -cover results was documented by the comparison of classes derived from the Aspen AOI 2011 QB2 and WV2 images (e.g., Figure 5). The classifications were generally consistent across all seven well-pad sites, with pixel-to-pixel agreement per pad ranging from 79% to 92%. The overlay of Aspen AOI 2011
-cover results was documented by the comparison of classes derived from the Aspen AOI 2011 QB2 and WV2 images (e.g., Figure 5). The classifications were generally consistent across all seven well-pad sites, with pixel-to-pixel agreement per pad ranging from 79% to 92%. The overlay of Aspen AOI 2011 ![]() land
land![]() -cover results demonstrated that when inconsistent classifications occurred, they tended to be in transition zones between classes and around the edges of the well pads, likely because of differences in sun and image-
-cover results demonstrated that when inconsistent classifications occurred, they tended to be in transition zones between classes and around the edges of the well pads, likely because of differences in sun and image-![]() acquisition
acquisition![]() angles.
angles.
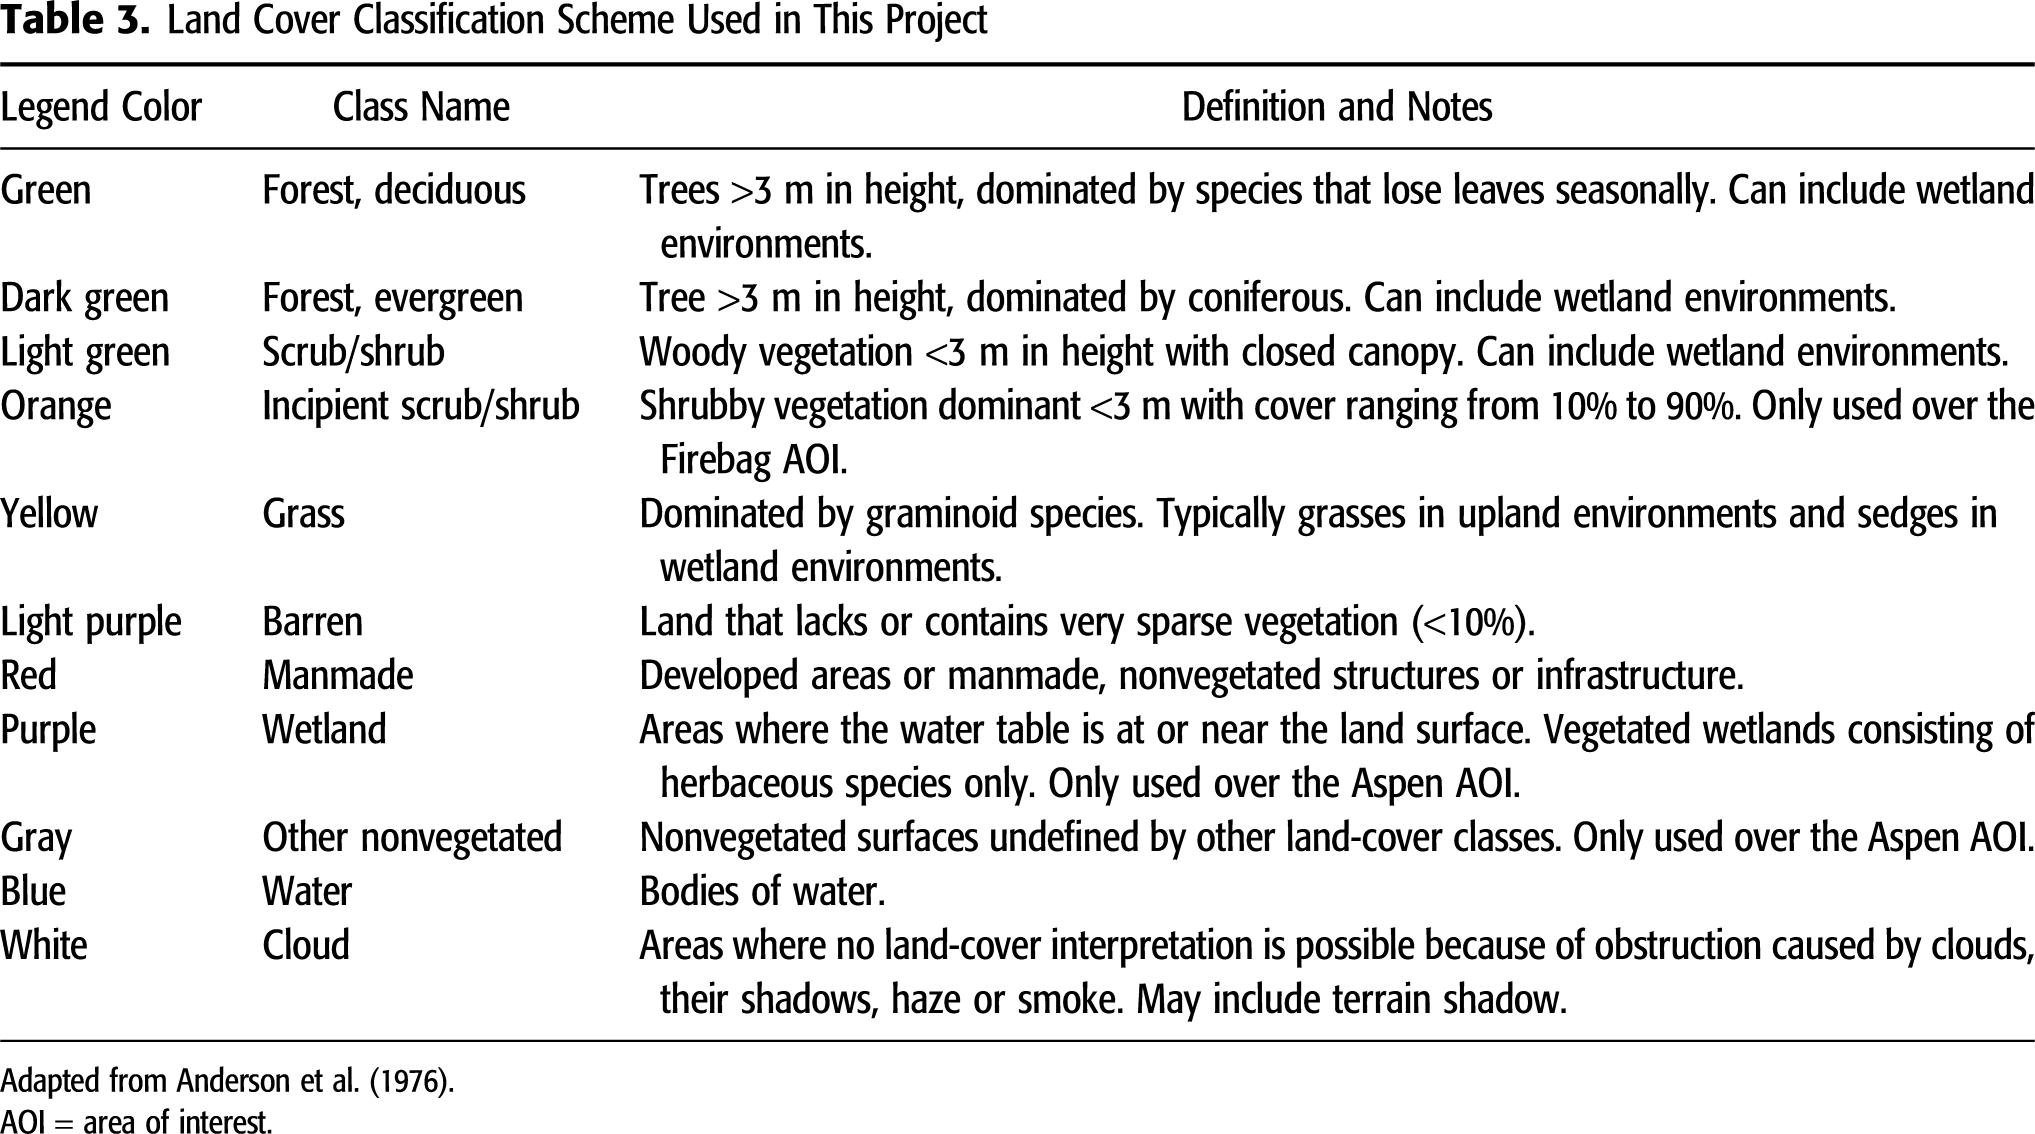
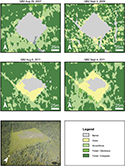 Figure 5. Time series of satellite-derived
 ![]() land
land![]() -cover classification for Aspen area of interest well pad 07-23-93-7 accompanied by helicopter photography from 2011 (lower left). Vegetation encroachment is apparent from 2007 to 2011. Within the buffer zones of the two images from 2011, apparent differences in “scrub/shrub” cover are likely a relic of the difference in image off-nadir
-cover classification for Aspen area of interest well pad 07-23-93-7 accompanied by helicopter photography from 2011 (lower left). Vegetation encroachment is apparent from 2007 to 2011. Within the buffer zones of the two images from 2011, apparent differences in “scrub/shrub” cover are likely a relic of the difference in image off-nadir ![]() acquisition
acquisition![]() angle (QuickBird-2 [QB2]: 19.11° and WorldView-2 [WV2]: 9.92°). This relic is more apparent on a larger scale where north–south-oriented seismic lines are apparent or obscured, depending.
angle (QuickBird-2 [QB2]: 19.11° and WorldView-2 [WV2]: 9.92°). This relic is more apparent on a larger scale where north–south-oriented seismic lines are apparent or obscured, depending.
Revegetation Progress
A visualization of change from nonvegetated to vegetated classes for an example well pad is provided for 2007–2011 in Figure 5. The earliest images over the Aspen AOI were collected postdevelopment. In 2007, well pads were dominated by “barren” (mean = 51%, standard deviation = 32%) and “other nonvegetated” (mean = 43%, standard deviation = 28%) (Figure 6). Barren ![]() land
land![]() cover displayed steady decline from 2007 to 2011 whereas other nonvegetated was virtually absent by 2009 (Figure 6). Grass coverage increased from near 0% in 2007 to 62% (standard deviation = 23%) in 2011 (Figure 6). Patterns of other vegetated classes are less clear with apparent increases in 2009 (Figure 6).
cover displayed steady decline from 2007 to 2011 whereas other nonvegetated was virtually absent by 2009 (Figure 6). Grass coverage increased from near 0% in 2007 to 62% (standard deviation = 23%) in 2011 (Figure 6). Patterns of other vegetated classes are less clear with apparent increases in 2009 (Figure 6).
 Figure 6. Revegetation progress within the Aspen area of interest. Mean and standard deviation were calculated by class across the seven well pads in 2007, 2009, and 2011 on off-nadir
 ![]() acquisition
acquisition![]() angle.
angle.
Firebag Area of Interest
Land-cover Classification and Visual-Accuracy Assessment
As with the Aspen AOI, comparison of ![]() land
land![]() -cover classification to helicopter-collected images suggested that classes were accurate in general. Use of pixel-by-pixel classification in the final workflow deployment successfully captured the heterogeneity observed in the field, improving delineation between
-cover classification to helicopter-collected images suggested that classes were accurate in general. Use of pixel-by-pixel classification in the final workflow deployment successfully captured the heterogeneity observed in the field, improving delineation between ![]() land
land![]() -cover classes on the pads. Postclassification analyses via projection of well-pad footprints through the Alberta Wetland Inventory (Alberta Environment and Parks, 2017) indicated that 14 of the well pads were classified as upland, 11 were classified as swamp, and 13 were classified as fen or bog.
-cover classes on the pads. Postclassification analyses via projection of well-pad footprints through the Alberta Wetland Inventory (Alberta Environment and Parks, 2017) indicated that 14 of the well pads were classified as upland, 11 were classified as swamp, and 13 were classified as fen or bog.
Ground-Truth and Formal-Accuracy Assessment
Across the 16 well pads and buffer zones, a total of 241 ground-truth points were collected (Table 5). Producer’s accuracy ranged from 25% to 82% (mean = 68%) and user’s accuracy ranged from 50% to 91% (mean = 69%). In both cases, forest classes had the lowest overall accuracy followed by “Barren” (Table 5). Relatively low accuracy values occurred where sample size was low (Table 5). The remaining vegetated classes exhibited strong producer’s and user’s accuracy. The overall accuracy was 79% with a kappa coefficient of 72% and a Tau coefficient of 71%.

Revegetation Progress
Imagery from 2014 captured only two cloud-free well pads in the southern part of the AOI. Thus, 2014 was excluded from subsequent analyses. Across the remaining six analysis years, the number of pads with sufficient cloud-free coverage for ![]() land
land![]() -cover classification in each year ranged from 32 to 38 (mean = 36). Prior to development in 2010, well pads were dominated by “forest, evergreen” (mean = 40.6%, standard deviation = 36.4%) and “scrub/shrub” (mean = 39.2%, standard deviation = 34.4%). Development of well pads in late 2010 was marked by large declines in “forest, evergreen” and “scrub/shrub” with corresponding increases in “barren” and “grass” cover in 2011 (Figure 7). Although “barren” cover peaked in 2011 (mean = 53.6%, standard deviation = 36.2%) and showed steady declines thereafter, “grass” cover peaked in 2012 (mean = 48.4%, standard deviation = 32.0%) and was variable through 2016. both “incipient scrub/shrub” and “scrub/shrub” displayed minima in 2011 and increased from 2012 to 2016 (Figure 7). A visualization of
-cover classification in each year ranged from 32 to 38 (mean = 36). Prior to development in 2010, well pads were dominated by “forest, evergreen” (mean = 40.6%, standard deviation = 36.4%) and “scrub/shrub” (mean = 39.2%, standard deviation = 34.4%). Development of well pads in late 2010 was marked by large declines in “forest, evergreen” and “scrub/shrub” with corresponding increases in “barren” and “grass” cover in 2011 (Figure 7). Although “barren” cover peaked in 2011 (mean = 53.6%, standard deviation = 36.2%) and showed steady declines thereafter, “grass” cover peaked in 2012 (mean = 48.4%, standard deviation = 32.0%) and was variable through 2016. both “incipient scrub/shrub” and “scrub/shrub” displayed minima in 2011 and increased from 2012 to 2016 (Figure 7). A visualization of ![]() land
land![]() -cover change over two example well pads from 2010 to 2016 is presented in Figure 8.
-cover change over two example well pads from 2010 to 2016 is presented in Figure 8.
 Figure 7. Revegetation progress within the Firebag area of interest. Mean and standard deviation were calculated by class across the well pads in 2010, 2011, 2012, 2013, 2015, and 2016.
 Figure 8. Time-series satellite-derived
 ![]() land
land![]() -cover classification for two well pads within the Firebag areas of interest. Note that the
-cover classification for two well pads within the Firebag areas of interest. Note that the ![]() land
land![]() -cover legend appears at the bottom of the figure. FR-11-29 (left panels) and FR-11-53 (right panels) are representative relatively rapid and relatively slow revegetation observed across this area of interest, respectively. The 2010
-cover legend appears at the bottom of the figure. FR-11-29 (left panels) and FR-11-53 (right panels) are representative relatively rapid and relatively slow revegetation observed across this area of interest, respectively. The 2010 ![]() land
land![]() -cover classification represents the well pads prior to disturbance, 2012 data represent the well pads 2 yr after disturbance, and the 2016
-cover classification represents the well pads prior to disturbance, 2012 data represent the well pads 2 yr after disturbance, and the 2016 ![]() land
land![]() -cover classification represents the well pads 6 yr after disturbance.
-cover classification represents the well pads 6 yr after disturbance.
SUMMARY AND CONCLUSIONS
The results of this work indicated that ![]() land
land![]() -cover classifications derived from high-spatial-resolution satellite imagery can be used to accurately characterize OSE well pads (Table 5) and to track revegetation over time (Figures 5–8). Satellite imagery reliably captured relevant
-cover classifications derived from high-spatial-resolution satellite imagery can be used to accurately characterize OSE well pads (Table 5) and to track revegetation over time (Figures 5–8). Satellite imagery reliably captured relevant ![]() land
land![]() -cover types discernable in the helicopter-collected photography (Figure 4). This is currently the accepted regulatory approach for monitoring the reclamation status of OSE well pads in Alberta, Canada. The geodetically consistent satellite imagery is potentially more reliable for monitoring and detection of change across time than repeat helicopter-collected photography acquired at oblique viewing angles and from variable vantage points. The reproducible processing and classification workflow (Figure 2), developed from widely-accepted remote-sensing practices, yielded consistent classification across images from different collection dates and satellite sensors. The straightforward nature of the developed workflow lends itself to adaptation where needed and to future operational use.
-cover types discernable in the helicopter-collected photography (Figure 4). This is currently the accepted regulatory approach for monitoring the reclamation status of OSE well pads in Alberta, Canada. The geodetically consistent satellite imagery is potentially more reliable for monitoring and detection of change across time than repeat helicopter-collected photography acquired at oblique viewing angles and from variable vantage points. The reproducible processing and classification workflow (Figure 2), developed from widely-accepted remote-sensing practices, yielded consistent classification across images from different collection dates and satellite sensors. The straightforward nature of the developed workflow lends itself to adaptation where needed and to future operational use.
Comparisons among classifications and oblique, helicopter-collected imagery suggested that classification results were more reliable away from the edges of well pads. Misclassifications relating to “forest, evergreen” occurred along well-pad margins for all imagery used. These misclassifications were predominantly driven by the effect of the image-![]() acquisition
acquisition![]() angle and sun angle, which can cause trees and/or tree shadows to obscure underlying
angle and sun angle, which can cause trees and/or tree shadows to obscure underlying ![]() land
land![]() cover. The advent of high-spatial-resolution commercial satellite sensors equipped with directional capabilities not only increases return frequency, but also increases the prevalence of off-nadir observations (Figure 5). As is common with remote-sensing data over heterogeneous habitat types, delineating localized transition zones between classifications can be challenging.
cover. The advent of high-spatial-resolution commercial satellite sensors equipped with directional capabilities not only increases return frequency, but also increases the prevalence of off-nadir observations (Figure 5). As is common with remote-sensing data over heterogeneous habitat types, delineating localized transition zones between classifications can be challenging.
An herbaceous wetland class was used in the schema for workflow development over the Aspen AOI. This class was found to be too restrictive because of the prevalence of shrub-dominated peatlands and spruce-dominated bogs beyond well-pad margins. However, inclusion of shrub and/or forest vegetation into a general “wetland” class could obscure recognition of the revegetation trajectory. Therefore, wetland classification was conducted outside of the remote-sensing workflow over the Firebag AOI. In this landscape, some functionally similar plant taxa can dominate both upland and wetland settings (e.g., shrubs in the Ericaceae family). If future research reveals that inclusion of the “wetland” class is important in understanding ecological dynamics on well pads, additional work will be needed to define a more detailed wetlands schema and evaluate automated tactics for incorporating ancillary data such as detailed DEMs or training sets to classify wetlands on well pads.
Alberta Energy Regulator guidance on site-reclamation certification (Alberta Energy Regulator, 2016) specifies criteria for evaluating landscape, soil, and vegetation characteristics. This study demonstrated that satellite-derived observations are well suited to detecting and/or monitoring well-pad vegetation over time. In general, results suggested that establishment of graminoid taxa was the most common mode of ecological succession in the Aspen AOI whereas shrub invasion was dominant in the Firebag AOI (Figures 6, 7). Future work could assess potential differences in ecological trajectory with respect to wetland classification or other geomorphological factors. Furthermore, analysis of plot data to understand within-class plant community composition would be beneficial for predicting long-term development and assessing potential management needs. The AER guidance further specifies that relative vegetation vigor in the assessment point be compared with a similar assessment point in the undisturbed buffer zone. Although outside of the scope of this work, pointwise comparisons as such are achievable with remote-sensing methods. In conclusion, this study demonstrated that high-spatial-resolution satellite imagery and straightforward workflows have the potential for operational deployment within the monitoring and regulatory context in Alberta, Canada and could reduce safety risks and logistical challenges associated with current monitoring practices over these remote sites.
REFERENCES CITED
Alberta Energy Regulator, 2014, Oil sands exploration and coal exploration application guide: Calgary, Alberta, Canada, Alberta Energy Regulator, Manual 008, 12 p., accessed May 24, 2016, http://www.aer.ca/documents/manuals/Manual008.pdf.
Alberta Energy Regulator, 2016, Application submission requirements and guidance for reclamation certificates for well sites and associated facilities: Calgary, Alberta, Canada, Alberta Energy Regulator, Specified enactment direction 002, 42 p.
Alberta Environment and Parks, 2017, Alberta merged wetland inventory: GIS data, vector digital data: Edmonton, Alberta, Canada, Government of Alberta.
Alberta Environment and Sustainable Resource Development, 2014, Update report on Alberta environment and sustainable resource development’s upstream oil and gas reclamation certificate program: Edmonton, Alberta, Canada, Government of Alberta, 7 p., accessed September 15, 2016, http://aep.alberta.ca/![]() land
land![]() /
/![]() land
land![]() -industrial/programs-and-services/reclamation-and-remediation/upstream-oil-and-gas-reclamation-and-remediation-program/documents/UpstreamOilGasReclamationReport-Mar2014.pdf.
-industrial/programs-and-services/reclamation-and-remediation/upstream-oil-and-gas-reclamation-and-remediation-program/documents/UpstreamOilGasReclamationReport-Mar2014.pdf.
Anderson, J. R., E. E. Hardy, J. T. Roach, and R. E. Witmer, 1976, A ![]() land
land![]() use and
use and ![]() land
land![]() cover classification system for use with remote sensor data: Alexandria, Virginia, US Geological Survey, Professional Paper 964, 28 p.
cover classification system for use with remote sensor data: Alexandria, Virginia, US Geological Survey, Professional Paper 964, 28 p.
Atkinson, N., D. J. Utting, and S. M. Pawley, 2014, Glacial landforms of Alberta, Canada: GIS data, line features: Calgary, Alberta, Canada, Alberta Energy Regulator, AER/AGS Digital Dataset 2014-0022, accessed August 12, 2016, http://ags.aer.ca/publications/MAP_604.html.
Birth, G. S., and G. R. McVey, 1968, Measuring color of growing turf with a reflectance spectrophotometer: Agronomy Journal, v. 60, no. 6, p. 640–649, doi:10.2134/agronj1968.00021962006000060016x.
Boukir, S., S. Jones, and K. Reinke, 2012, Fast mean-shift based classification of very high resolution images: Application to forest cover mapping: Proceedings of the ISPRS Annals of the Photogrammetry, Remote Sensing, and Spatial Information Sciences, v. I-7, Melbourne, Victoria, Australia, August 25–September 1, 2012, p. 111–116, doi:10.5194/isprsannals-I-7-111-2012.
Congalton, R. G., and K. Green, 2008, Assessing the accuracy of remotely sensed data: Principles and practices, 2nd ed.: Boca Raton, Florida, CRC Press, 200 p, doi:10.1201/9781420055139.
Daughtry, C. S. T., C. L. Walthall, M. S. Kim, E. Brown de Colstoun, and J. E. McMurtrey, III, 2000, Estimating corn leaf chlorophyll concentration from leaf and canopy reflectance: Remote Sensing of Environment, v. 74, no. 2, p. 229–239, doi:10.1016/S0034-4257(00)00113-9.
Fenton, M. M., E. J. Waters, S. M. Pawley, N. Atkinson, D. J. Utting, and K. Mckay, 2013, Surficial geology of Alberta; Calgary, Alberta, Canada, Alberta Energy Regulator, AER/AGS Map 601, scale 1:1,000,000, accessed August 28, 2016, http://ags.aer.ca/publications/MAP_601.html.
Graf, M. D., 2009, Literature review on the restoration of Alberta’s boreal wetlands affected by oil, gas and in situ oil sands development: Edmonton, Alberta, Canada, Ducks Unlimited Canada, 59 p.
Huete, A. R., 1988, A soil-adjusted vegetation index (SAVI): Remote Sensing of Environment, v. 25, no. 3, p. 295–309, doi:10.1016/0034-4257(88)90106-X.
Huguenin, R. L., M. S. Bouchard, C. A. Penney, E. A. Conlon, and G. R. Waddington, 2013, Applied analysis image calibrator (AAIC): Automatic retrieval of ground reflectance from spectral imagery: Westford, Massachusetts, Applied Analysis, accessed November 15, 2013, www.hexagon-solutions.com.cn/Libraries/White_Papers/AAIC_Application_Technical_Description.sflb.pdf.
Jordan, C. F., 1969, Derivation of leaf area index from quality of light on the forest floor: Ecology, v. 50, no. 4, p. 663–666, doi:10.2307/1936256.
Kauth, R. J., and G. S. Thomas, 1976, The tasseled cap—A graphic description of the spectral-temporal development of agricultural crops as seen in Landsat: LARS Symposia, West Lafayette, Indiana, Purdue University, June 29–July 1, 1976, p. 41–51.
Kuester, M. A., 2016, Absolute radiometric calibration 2015v2: Longmont, Colorado, DigitalGlobe, 18 p.
Ma, Z., and R. Redmond, 1995, Tau coefficients for accuracy assessment of classification of remote sensing data: Photogrammetric Engineering and Remote Sensing, v. 61, p. 435–439.
Natural Regions Committee, 2006, Natural regions and subregions of Alberta, in Downing, D. J., and W. W. Pettapiece, eds., Publication No. T/852: Edmonton, Alberta, Canada, Government of Alberta, 264 p.
Ozdemir, I., 2008, Estimating stem volume by tree crown area and tree shadow area extracted from pan-sharpened Quickbird imagery in open Crimean juniper forests: International Journal of Remote Sensing, v. 29, no. 19, p. 5643–5655, doi:10.1080/01431160802082155.
Podger, N. E., W. B. Colwell, and M. H. Taylor, 2011, GeoEye-1 radiance at aperture and planetary reflectance: Longmont, Colorado, GeoEye, DigitalGlobe, 5 p.
Powers, R. P., N. C. Coops, J. L. Morgan, M. A. Wulder, T. A. Nelson, C. R. Drever, and S. G. Cumming, 2013, A remote sensing approach to biodiversity assessment and regionalization of the Canadian boreal forest: Progress in Physical Geography, v. 37, no. 1, p. 36–62, doi:10.1177/0309133312457405.
Prior, G. J., B. Hathway, P. M. Glombick, D. I. Pană, C. J. Banks, D. C. Hay, C. L. Schneider, M. Grobe, R. Elgr, and J. A. Weiss, 2013, Bedrock geology of Alberta; Calgary, Alberta, Canada, Alberta Energy Regulator, AER/AGS Map 600, scale 1:1,000,000, 1 sheet, accessed August 3, 2016, http://ags.aer.ca/publications/MAP_600.html.
Robinson, D. J., N. J. Redding, and D. J. Crisp, 2002, Implementation of a fast algorithm for segmenting SAR imagery, scientific and technical report: Edinburgh, South Australia, Australia, Defense Science and Technology Organization, 34 p.
Rochdi, N., 2012, Monitoring procedures for site reclamation in Alberta - temporal monitoring of reclamation success using satellite remote sensing: Lethbridge, Alberta, Canada, University of Lethbridge, Alberta Terrestrial Imaging Centre, Report No. ATIC-2012-004, 34 p.
Rochdi, N., J. Zhang, K. Staenz, X. Yang, B. James, D. Rolfson, S. Patterson, and A. Purdy, 2014, A remote sensing based system for monitoring reclamation in well and mine sites: 2014 Geospatial Monitoring and Analytics Forum, Calgary Alberta, Canada, Petroleum Technology Alliance of Canada, April 28, 2014, 32 p.
Rouse, J. W., R. H. Haas, J. A. Schell, and D. W. Deering, 1973, Monitoring vegetation systems in the Great Plains with ERTS, in S. C. Freden, E. P. Mercanti, and M. Becker, eds., Third Earth Resources Technology Satellite–1 Symposium, Volume I: Technical Presentations: Washington, DC, NASA, SP-351, p. 309–317.
Sánchez-Azofeifa, G. A., M. Chong, J. Sinkwich, and S. Mamet, 2005, Alberta ground cover characterization (AGCC) training and procedures manual: Edmonton, Alberta, Canada, Earth Observation Systems Laboratory, Department of Earth and Atmospheric Sciences, University of Alberta Edmonton, 64 p.
Smith, F. G. F., C. Bolton, and C. Jengo, 2004, The classification of hyperspectral data using the CART classification approach: American Society of Photogrammetry and Remote Sensing Conference Proceedings, Denver, Colorado, May 25, 2004, 12 p.
Smith, S. B., A. S. Mann, R. A. Hursey, R. T. Seidner, and B. Kasinska-Banas, 1979, Alberta oil sands environmental research program interim report covering the period April 1975 to November 1978: Edmonton, Alberta, Canada, Alberta Oil Sands Environmental Research Program, 101 p., accessed March 22, 2014, http://hdl.handle.net/10402/era.30599.
Tucker, C. J., 1979, Red and photographic infrared linear combinations for monitoring vegetation: Remote Sensing of Environment, v. 8, no. 2, p. 127–150, doi:10.1016/0034-4257(79)90013-0.
Updike, T., and C. Comp, 2010, Radiometric use of WorldView-2 imagery, technical note: Longmont, Colorado, DigitalGlobe, accessed May 1, 2015, https://dg-cms-uploads-production.s3.amazonaws.com/uploads/document/file/104/Radiometric_Use_of_WorldView-2_Imagery.pdf.
US Geological Survey, 2015, Global food security-support analysis data at 30 m: Models and algorithms, accessed February 15, 2016, http://geography.wr.usgs.gov/science/croplands/models.html.
US Geological Survey, 2017, Using the USGS Landsat 8 Product, accessed September 1, 2017, https://landsat.usgs.gov/using-usgs-landsat-8-product.
Vitt, D. H., L. A. Halsey, M. N. Thormann, and T. Martin, 1996, Peatland inventory of Alberta: Phase 1: Overview of peatland resources in the natural regions and subregions of the province: Edmonton, Alberta, Canada, University of Alberta, 117 p.
AUTHORS
Cynthia K. Dacre manages the US geologic programs for Radiant Solutions. She received her M.A. degree in geology from the University of Missouri-Columbia, and her B.S. degree in geology from State University of New York (SUNY) Binghamton (now Binghamton University). Her professional interests include using remote-sensing data for environmental monitoring; hydrocarbon, mineral, and water exploration; and various civil applications.
David A. Palandro is the environmental technology team lead for the ExxonMobil Upstream Research Company. His research topics include marine ecosystems, oil-spill response, and remote-sensing, while providing support to ExxonMobil’s global operating companies. David obtained a Ph.D. in marine science from the University of South Florida in 2006.
Anna Oldak has over 20 years of experience leading environmental remote-sensing and geographic information system (GIS) projects. She received a Ph.D. in earth sciences, physical geography domain, from University of Warsaw (Poland) and held a postdoctoral position at the US Department of Agriculture (USDA) prior to joining MDA Information Systems LLC (now Radiant Solutions).
Alex W. Ireland is broadly trained as an ecologist and received a Ph.D. in earth and environmental sciences from Lehigh University in 2012. Alex has worked at ExxonMobil Biomedical Sciences, Inc. since 2013, serving as an internal consultant and researcher focusing predominantly on the application of applied ecology and geospatial sciences to environmental business planning, reclamation, and site monitoring.
Sean M. Mercer received his Ph.D. in green chemistry from Queen’s University (Kingston, Ontario, Canada) in 2012. Since 2014, he has led a diverse environmental research and development program at one of Imperial Oil Limited’s research centers, Sarnia Technology Applications and Research (Sarnia, Ontario, Canada). Currently, his team is focused on developing novel site-remediation technologies and tools for long-term environmental monitoring.
ACKNOWLEDGMENTS
We thank Tara Shackleton, formerly of Imperial Oil Limited, for providing helicopter images, operational information used in this project, and logistical support for fieldwork. We acknowledge Mihir Datta Chaudhuri, Francois Smith, Greg Koeln, and two anonymous reviewers for constructive comments on this manuscript.