The AAPG/Datapages Combined Publications Database
AAPG Bulletin
Full Text
![]() Click to view page images in PDF format.
Click to view page images in PDF format.
AAPG Bulletin, V.
DOI: 10.1306/10242221068
Numerical modeling of microfracturing and primary hydrocarbon expulsion in the Jurassic Lower Tuwaiq Mountain Shale: A conceptual framework
Syed Haider,1 Tadeusz W. Patzek,2 Thomas Finkbeiner,3 and Ralf Littke4
1The Ali I. Naimi Petroleum Engineering Research Center, King Abdullah University of Science and Technology (KAUST), Thuwal, Saudi Arabia; [email protected]
2The Ali I. Naimi Petroleum Engineering Research Center, KAUST, Thuwal, Saudi Arabia; [email protected]
3The Ali I. Naimi Petroleum Engineering Research Center, KAUST, Thuwal, Saudi Arabia; [email protected]
4Institute for Geology and Geochemistry of Petroleum and Coal, RWTH Aachen University, Aachen, Germany; [email protected]
Abstract
This paper presents a geomechanical model of microcrack growth coupled with thermal maturation data for the Tuwaiq Mountain Formation, Jafurah Basin, Saudi Arabia. We set out to capture the basin evolution in terms of resource capacity and pore pressure. The overpressure that evolves in the organic matter-rich units during kerogen–oil conversion controls the creation and growth of horizontal and vertical microcracks between 65 and 60 Ma, according to our model. The crack coalescence time varies between 2 and 5 Ma. Vertical microcracks formed between 55 and 50 Ma, at a markedly higher overpressure than that for the horizontal microcracks. The rate of microcrack growth, organic matter content, and thermal maturity control the timing of microcrack coalescence that creates a rock-spanning cluster and enables primary migration of some of these hydrocarbons out of the source rock. With vertical permeabilities of 300 to 500 nd and expulsion efficiency of 70%, primary migration stopped between 30 and 25 Ma. Plastic bitumen and brittle solid pyrobitumen, produced during secondary cracking of oil to gas, remain in isolated clusters that sever flow pathways and limit loss of pore pressure. The flow of gas microbubbles and oil droplets through the plastic bitumen preserves overpressure for millions of years, with a pressure decrease of 5 to 10 MPa. Balancing the hydrocarbon mass, and assuming that 10 Ma is the shortest time required to disconnect flow, we estimate the final pore pressure (Pp) in the Tuwaiq Mountain Limestone Formation to be between 6500 and 9000 psi (45 and 62 MPa), Pp/Sv = 0.47 − 0.7, where Sv is the vertical stress. The methane gas storage capacity of the Tuwaiq Mountain Formation is 500–700 SCF/t source rock (14.2–20 m3/t source rock).
INTRODUCTION
Organic matter-rich mudrocks are currently targeted for unconventional oil and gas exploration. The highly uncertain and commonly exaggerated (Patzek et al., 2013, 2014, 2019; Eftekhari et al., 2018, 2020; Saputra et al., 2019, 2020, 2022a, b; US Energy Information Administration, 2019; Haider et al., 2020) total oil and gas mudrock resource potential of the world is estimated at 535 billion t and 588 Tm3 (35 TSCF), respectively (Tong et al., 2018). Saudi Arabia has recoverable shale gas reserves of 17 Tm3 (Sorkhabi, 2019). For basins with moderate to high thermal maturity, most of the porosity and thus producible hydrocarbons are stored in the organic matter nanopores (Curtis et al., 2012; Fishman et al., 2014; Saidian et al., 2014; Klaver et al., 2015, 2016; Pommer and Milliken, 2015; Gu et al., 2016; Haider and Patzek, 2020). During a basin’s thermal maturation, its organic matter converts into a residue (bitumen/pyrobitumen) and compositionally different hydrocarbons. The conversion pathway is governed by the rate of thermal heating, chemical properties of organic matter, and source rock composition (abundance of sulfur and clay minerals, for example). Moreover, textural and structural evolution and pore size distribution depend mostly on the geological conditions (depth, temperature, and stresses) and the source rock characteristics (kerogen content and type, mineralogy, pore water content, chemical composition of the source rock, etc.) (Han et al., 2006; Helgeson et al., 2009; Jarvie, 2012; Jin et al., 2013; Gasparik et al., 2014; Craddock et al., 2015; Lin et al., 2015; Wu et al., 2015; Ko et al., 2016; Mathia et al., 2016; Gorynski et al., 2019). These parameters determine unique maturation and hydrocarbon expulsion paths for each source rock and thus, result in a wide range of associated resource volumes, chemical compositions (bitumen, crude oil, condensate, natural gas), and ultimate recovery factors. Hence, understanding and constraining the parameters governing kerogen maturation and hydrocarbon migration are important for unconventional resource development and successful well delivery.
In mature basins, the mostly thin laminae of organic matter form in response to compaction and deformation during burial. From the perspective of this work, the most important structural change of a source rock during thermal maturation (Katsube et al., 1992; Katsube, 2000; Zhu et al., 2018) is the creation of bedding-parallel microcracks (Littke et al., 1988). Experimental evidence by O’Brien et al. (2002), Kobchenko et al. (2011, 2014), Panahi et al. (2014), Ougier-Simonin et al. (2016), Guo et al. (2017), and Saif et al. (2019) reveals the creation of these microcracks during the oil generation stage in response to local overpressure buildup. The existence of microcracks within the organic matter corroborates the idea that overpressure is the main reason for their creation (Luo and Dusseault, 1997; Padin et al., 2014; Er et al., 2016; Teixeira et al., 2017; Panahi et al., 2019). The rate at which these microcracks grow, their final sizes, and the timing of their formation depend predominantly on the mechanical properties of the source rock, thermal maturation rate, and organic matter volume and geometry (Ungerer et al., 1981; Leythaeuser et al., 1988; Özkaya, 1988; Fan et al., 2012a, b; D. Dong et al., 2018; Yang and Mavko, 2018; Hooker et al., 2019).
In addition to extensive bedding-parallel microcracks, vertical microcracks also form. The internal pressure required to create the latter cracks is believed to be higher than that for horizontal microcracks (Vernik, 1994; Marquez and Mountjoy, 1996; Lash and Engelder, 2005; Al Duhailan et al., 2013) because of tensile strength anisotropy and kerogen grain ellipticity. Both of these factors result in variable stress concentration along the periphery of the elliptic organic matter specks. The possibility of creating vertical microcracks also depends strongly on the magnitude of far-field stresses, in particular, the maximum and least principal stresses, S1 and S3, respectively.
Another important mudrock property is its anisotropic permeability. As a source rock is buried deeper, its pore water is squeezed out, thus decreasing the rock’s porosity and permeability (David et al., 1994; Ostermeier, 2001; Schutjens et al., 2004). Compacted shales at their terminal burial depth do not have macroscopically connected networks of fluid flow paths or the formation-spanning fluid clusters (Keller et al., 2013a; Cardott et al., 2015; Sun et al., 2015; Keller and Holzer, 2018; Zhang et al., 2020). The increase of overpressure during conversion of kerogen to oil opens rock to fluid flow in microfractures and to primary hydrocarbon migration (Uchida, 1987; Siddiqui and Lake, 1992; Neuzil, 1994; Dewhurst et al., 1998; Yang and Aplin, 1998; Yang et al., 2012; Kibodeaux et al., 2014; Adams et al., 2016; Rabbani et al., 2017; F. Dong et al., 2018; Panahi et al., 2019). Such microfractures are open, partly filled with plastic bitumen, or partly or completely filled with mineral cement (Leythaeuser et al., 1988; Hackley and Cardott, 2016), indicating that either an aqueous ![]() phase
phase![]() or oil
or oil ![]() phase
phase![]() flowed in these source rock fractures. Thus, at low water saturation and high oil saturation, single-
flowed in these source rock fractures. Thus, at low water saturation and high oil saturation, single-![]() phase
phase![]() fluid flow can occur, expelling mostly oil from the system.
fluid flow can occur, expelling mostly oil from the system.
Further maturation of organic matter leads to a complex evolution of rock permeability. Once primary migration stops, secondary cracking of oil to gas begins. Due to its lower density and higher volume, gas generation would principally lead to higher overpressure in an impermeable rock, as suggested by Ungerer et al. (1981). However, due to its higher solubility in water and diffusion coefficient, gas is much more easily lost from a source rock than oil. Thus, overpressure buildup/retention during the gas generation stage is extremely difficult because of fast gas diffusion through the connected pore network (Carslaw and Jaeger, 1959; Bredehoeft and Hanshaw, 1968; Neuzil, 1986; Bethke, 1988; Deming, 1994). Diffusion of fluid pressure through a rock layer of thickness z, takes time t, equal to
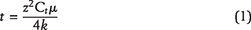
where Ct and k are the total rock compressibility and permeability, respectively, and μ is the fluid viscosity. If we assume the rock compressibility to be
 Pa−1, and use the dynamic viscosity of methane at 100 °C (13.4 × 10⁻⁶ Pa · s), equation 2 reduces to

To preserve an overpressure of 50 MPa in a 100-m-thick rock layer for 50 m.y., the permeability required from the above equation is 8.4894 × 10⁻²⁶ m2 = 10−5 nd. This value is five orders of magnitude lower than the commonly reported source rock permeabilities (Burrus et al., 1993). Thus, in the absence of zero permeability, it is practically impossible to maintain high pressure in mudrocks for millions of years. To explain the development and preservation of overpressure during gas generation, we propose that most of the gas flow pathways (microcracks and pore clusters) are blocked by the plastic bitumen and brittle solid pyrobitumen.
We couple pore pressure to rock heating and deformation by invoking generation of microcracks. Organic matter is assumed to be composed of independent kerogen patches. To couple localized fluid production in each kerogen patch with the associated microfracturing, we develop a numerical model of microcrack growth, primary migration of hydrocarbons, and overpressure generation in a mudrock. We use our model to explain the history and current state of the Jurassic Tuwaiq Mountain carbonaceous mudrock formation. Our model shows that a network of microfractures driven by the maturation overpressure assists in the mobilization of bitumen and oil. We also show that a complex evolution of the isolated gas clusters during the secondary oil cracking stage is a probable mechanism that preserves gas overpressure in the source rock for millions of years.
Our approach is as follows: First, we consider thermal maturation of the Tuwaiq Mountain Formation. This process depends on the distribution and history of in situ stresses in the Jafurah Basin. Next, we present a model of the distribution of organic matter in the source rock and the related conditions of horizontal and vertical microfracturing in response to the kerogen–oil conversion that overpressures the rock. We then present the concept of critical porosity and show how the interconnected vertical and horizontal microcracks create a permeable system. The volume of organic matter and rate of its thermal maturation control the timing of microcrack coalescence and induce primary migration of hydrocarbons. To quantify the extent of this migration, we present a reasonable hypothesis of vertical permeability range in the past, considering pore blocking by bitumen, permeability anisotropy, and stress release during coring.
Our study aims to demonstrate the usefulness of a coupled geological and geomechanical model to assess primary hydrocarbon migration, gas retention potential, and overpressure buildup for a source rock deposit. The stress states, stress equations, and geomechanical and geological properties used in the modeling are specific to the Tuwaiq Mountain Formation in the Jafurah Basin, Saudi Arabia. The data used in our model have been collected from limited published literature. Thus, to generalize this study, we performed a sensitivity analysis of the geomechanical parameters associated with the basin. The procedure outlined in the paper is a first step to quantifying different aspects of one basin. Translating our approach to other basins would require a problem setup that depends on the evolution history, structural properties, geomechanical properties, and other geological conditions of the specific basin under study.
TUWAIQ MOUNTAIN FORMATION
Geological Setting
During the Mesozoic, the Afro-Arabian plate evolved as a continental shelf (see Figure 1). It was bounded by the Neo-Tethys sea on the northeast and by the Arabian shield on the west and south. During the Jurassic and much of the Cretaceous, deposition in the Arabian Gulf was dominated by marine platform carbonates (Steineke et al., 1958; Powers et al., 1966; Murris, 1980; Ayres et al., 1982; Beydoun, 1991) that developed in response to marine transgressions at the southwestern margin of the Tethys ocean (Murris, 1980; Al-Husseini, 1997). Differential subsidence and local structuring within the shelf formed the relatively short-lived intrashelf basins. In eastern Saudi Arabia, one of these intrashelf basins, the Arabian Basin, existed from late Callovian to early Kimmeridgian. The shallow-water setting of the basin and high organic productivity restricted seawater circulation and preserved a thick sequence of laminated, organically rich sediments (Carrigan et al., 1995). The eustatic sea-level rise and fall led to variation in the sedimentary facies throughout the basin.
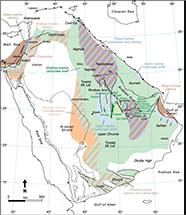 Figure 1. Generalized geological map and cross section of the Arabian Peninsula showing the escarpments in the central part of Saudi Arabia. The escarpments were formed by differential erosion of altering resistant sandstones and limestones and more easily eroded siltstones and mudstones. Source: Abd El Aal (2017). Gp. = Group; Med. = Mediterranean; Tuwaiq Mt. Lst. = Tuwaiq Mountain Limestone; U.A.E. = United Arab Emirates.
In the southwestern part of the basin, the main source rock facies is the Tuwaiq Mountain Formation. The thickness of the source rock facies exceeds 500 ft (152 m) in the center of the basin and thins laterally. In the northeastern area, the source rock facies overlies the Hadriya reservoir. With few exceptions of minor uplift and erosion episodes, the Tuwaiq Mountain Formation in the Jafurah Basin has been continuously subsiding (Droste, 1990). Its present depth of 11,500 ft (3.5 km) is the maximum burial to date. The subsurface temperature is high because of high basal heat flow, with an average temperature gradient of 30°C/km.
Lithofacies
Figure 2 shows the generalized geological column of the Middle and Upper Jurassic stratigraphy of Saudi Arabia (Cantrell et al., 2014). The Tuwaiq Mountain Limestone Formation (TMLF) falls in the Middle Jurassic and is the main source rock for the major oil and gas accumulations discovered in Late Jurassic carbonate reservoirs in Saudi Arabia (Cole et al., 1994; Carrigan et al., 1995). The TMLF is one of seven formations that constitute the Shaqra Group of Saudi Arabia (EL-Sorogy et al., 2016) and overlies unconformably the Dhruma Formation. The combined thickness of the formation is 295 m. It is unconformably overlain by the Hanifa Formation. This calcareous source rock was deposited in a restricted marine environment within an intrashelf basin (Alsharhan and Kendall, 1986). The dark gray mudstone beds within the TMLF in outcrop represent proximity to the maximum flooding zone of the formation. The temperature variation and oxygen content of the depositional environment in the basin formed three facies in the TMLF in upward sequence: Baladiyah (T1), Maysiyah (T2), and Daddiyah (T3). The thicknesses of these sequences are 32, 56, and 96 m, respectively. The T1 consists of noxic, black, laminated wackestone to mud-dominated packstone; the T2 consists of dysoxic, black, horizontally microbioturbated, laminated to very thin-bedded wackestone to mud-dominated packstone; and the T3 consists of oxygenated, gray, bioturbated, thin-bedded wackestone to mud-dominated packstone. The sedimentary structures of the basin include undulating parallel lamination, microhummocky cross lamination, ripple lamination, microcut and fill lamination, and microtopographic infill lamination.
 Figure 2. Generalized stratigraphy of the Jurassic Period. Source: Cantrell et al. (2014). MTN = Mountain.
Source Rock Characteristics
The kerogen in the TMLF is of type II S, and the thickness of the formation is relatively uniform (100–150 ft [30–45 m]) (Katz, 2012). Type II S kerogen is principally derived from the well-preserved marine organic matter deposited in oxygen-deficient, commonly reducing sedimentary environments. It is characterized by high-intermediate initial H/C and low-intermediate O/C ratios. Out of the Lower, Middle, and Upper Jurassic successions, the Tuwaiq Mountain Formation of the Upper Jurassic Age is of the best quality and is relatively thick, with hydrogen indices ranging between 600 and 800 mg HC/g total organic carbon (TOC) (Cole et al., 1994). Hydrocarbon generation started circa 100 Ma and reached the peak oil generation stage at 70 Ma. Figure 3 shows the hydrocarbon generation potential and transformation ratio (TR) with time. The initial TOC before maturation was
 on average. The TOC after kerogen maturation was reduced to an average value of
 . Thermal maturity data (ranging between 1.4% and 1.6% vitrinite reflectance equivalent) indicate that the basin reached the peak oil generation window to wet-gas generation window. The TR defined by Tissot and Welte (1984) is the ratio of the petroleum (oil and gas) actually formed by the kerogen to the total amount of petroleum that the kerogen is capable of generating. The data for the histories of temperature gradient, hydrogen index, and TR are from Hakami and İnan (2016) and Hakami et al. (2016b). The average hydrocarbon generation potential is 775 mg HC/g TOC. Based on this average TOC value, the kerogen volume is given by Alfred et al. (2013) as
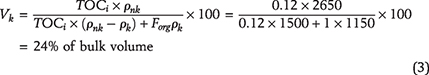
where ρnk and ρk are the densities of the inorganic matrix and kerogen, respectively; TOCi is the TOC fraction in the inorganic rock matrix before maturation (0.12); and Forg is the fraction of TOCi that is present in kerogen, set here to 1.
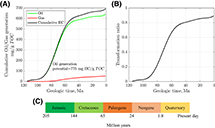 Figure 3. (A) Cumulative hydrocarbon (HC) (oil and gas) generated from the Tuwaiq Mountain (TQMN) Formation at well E. Adapted from Hakami and İnan (2016). (B) Transformation ratio of the kerogen with time. The maximum generation potential is 775 mg HC/g total organic carbon (TOC). The TQMN Formation generated 700 mg HC/g TOC. The kinetics used to model the oil/gas generation is taken from Hakami and İnan (2016) (Table 1).
The mineralogy and geomechanical properties of the source rock are controlled by the dominant carbonate minerals (calcite and dolomite) with very low clay content. Quartz and pyrite are also present as accessory minerals. Minimal clay content and an abundance of carbonate minerals tend to make formations more brittle, thus increasing the hydraulic fracture potential of the formations. The calcite-dominated, organic-rich layers are dominated by bedding-parallel microfractures developed during thermal maturation of the kerogen particles. The porous intervals between organic-rich units might hold the hydrocarbons generated from the associated organic-rich units.
Structural History and In Situ Stress in the Tuwaiq Mountain Formation
The Arab intrashelf basin developed during the low tectonic activity of the Middle and Late Jurassic. Tectonic stability of the deposited carbonates provided the foundation of a broad shelf region. As a result, the Tuwaiq Mountain Formation source rock is devoid of major fault zones or major fracture clusters, resulting in the accumulation of vast reserves (Wilson, 2020) and overpressure development. Tectonic stability (i.e., low strain and little internal deformation) also prevented structural compartmentalization. However, microfracture and mesofracture networks are prevalent (Ameen, 2019). Their formation depends on local processes related to burial and thermal maturation, rather than regional tectonics. Bedding parallel discontinuities include veins and beef fractures. Also, natural hydraulic fractures and natural shear fractures were created in response to the hydrocarbon generation in organic-rich units. Steeply dipping, natural hydraulic fractures were formed prior to or during mud compaction. The steeply to moderately dipping hairline joints and faults postdate the main compaction of the carbonate muds. The horizontal microfractures associated with the organic-rich units of the source rock are filled with bitumen, indicating their formation during thermal maturation of the organic matter.
The stress regime of the Arabian Peninsula has had a complex history because of the convergence and collision of the African and Eurasian plates (Badawy and Horváth, 1999). At present, the Arabian Peninsula is characterized by elevated horizontal compression, in particular on its eastern side toward the Arabian Gulf where the Jafurah Basin is situated. The gradient of vertical principal stress, ∂Sv/∂z, estimated from the overburden weight is 1.1–1.2 psi/ft (25–27 kPa/m). The gradient of minimum horizontal stress, ∂Sh/∂z, estimated using the multiple diagnostic fracturing injectivity tests is 0.86–0.96 psi/ft (19–1 kPa/m). The gradient of maximum horizontal stress, ∂SH/∂z, is estimated to be 1.2 psi/ft (27 kPa/m) (Al-Momin et al., 2015; Bartko et al., 2017). Thus, the regional stress regime is characterized by strike-slip/normal faulting, with SH ≥ Sv > Sh (Ameen et al., 2010; Ameen, 2014, 2019; MacPherson and Ameen, 2014). The present-day low stress differentials have persisted since the Late Cretaceous (100–66 Ma), during which the Tuwaiq Mountain Formation produced most of its primary oil (see Figure 3). In microfracture simulations during maturation (100–60 Ma) at a depth of 11,500 ft (3.5 km), SH is assumed to be very close to Sv, SH ≈ Sv with the common gradient of 1.2 psi/ft (27 kPa/m).
KEROGEN DISTRIBUTION MODEL AND PRESSURE INCREASE
Kerogen in source rocks occurs either as discrete layers (e.g., cyanobacterial mats and/or stromatolites) or is strongly enriched in discrete thin layers (e.g., seasonal algal blooms) or is finely disseminated as discrete particles. Although the original kerogen particles have different forms, they are strongly flattened in source rocks (e.g., in telalginite and lamalginite). Therefore, most petroleum source rocks are finely laminated, with organic matter oriented bedding parallel. Organic or organic matter-rich layers are interbedded with mineral layers containing little organic matter (e.g., clay minerals, other silicates, and carbonates) (Littke, 1993) (see Figure 4A, B). Bed interfaces are surfaces of mechanical weakness.
 Figure 4. (A) A Tuwaiq Mountain Formation escarpment along the Riyadh-Makkah highway. (B) A shale core having an interbedded organic-rich layer and carbonate layers. It represents the effect of changing sea level in the carbonate depositional platform. Source: Ferri et al. (2011). (C, D) Scanning electron microscopy images of Tuwaiq Mountain source rock showing the distribution of organic matter. The dark specks are made of kerogen. These specks are disconnected at the microscale. Source: Hakami (2016). ONP = organic nanopores.
During burial over geologic time, the deposited organic matter undergoes diagenetic changes. A closer look at the organic matter-rich layers reveals a complex distribution of organic and inorganic matter over a wide range of scales (from nanometers to tens of meters) (see Figure 4C, D). This complexity evolves during a basin’s burial and heating. At macroscale, organic matter may look like a continuous thin layer. However, at microscale, organic matter exists as disconnected patches of locally well-connected nanopores. Thus, we envisage a conceptual model in which organic matter consists of the individual and disconnected, micrometer-scale kerogen specks (see Figure 5B) separated by inorganic matter, such as clay minerals, calcite, dolomite, quartz, pyrite, etc. We are aware that our model is a simplification, but it is quite useful for setting up different what-if scenarios.
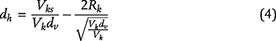
 Figure 5. (A) Most of the deposited kerogen specks become flattened ellipsoids because of increasing overburden weight during burial. A small fraction remains spherical in shape. (B) Elliptical and spherical kerogen specks are distributed in the organic matrix. The dh represents the distance between two kerogen specks, and dv is the vertical distance between microscopic kerogen layers. σh = horizontal stress; σv = vertical stress; H = kerogen height; Pp = pore pressure; Rk = kerogen radius.
The kerogen specks are the uniformly distributed ellipsoids with radius Rk and height H. The horizontal distance between the adjacent kerogen specks is dh, and the vertical distance between two kerogen speck layers is dv. The ellipticity, α, of the kerogen specks is defined by the ratio Rk/H. The kerogen volume of 24% of bulk volume, see equation 3 is assumed to consist of independent kerogen specks of volume 4 × 10⁻¹⁴ m3 each. The radii of these specks vary between 20 and 70 μm, and their heights vary between 5 and 30 μm. If Vk is the volume of kerogen per cubic meter of rock, and Vks is the volume of an average kerogen speck, the average distance, dh, between two specks is
MICROCRACK INITIATION IN THE KEROGEN SPECK
As organic matter is buried, increasing overburden weight and temperature facilitate conversion of kerogen to the lighter, hydrogen-enriched products, first to bitumen (soluble, still rather polar and rich in heteroatoms) and then into oil (almost pure hydrocarbons). To study microcrack initiation and its subsequent growth at the depth of interest, the vertical stress around a microcrack is calculated from its average gradient. The initial pore pressure, Pp, in a kerogen speck is assumed to be the hydrostatic pressure, Ph. With increasing burial, kerogen–oil kinetics causes pore pressure inside each speck to increase above Ph, as Pp = Ph + ΔP, where ΔP is the overpressure (see Figure 6A). The mathematical model of pore pressure increases inside a kerogen speck in response to kerogen–oil conversion is explained in Appendix 1. The local vertical and minimum horizontal principal stresses, σv and σh, impose tractions on the crack boundary that act against the volumetrically overpressured kerogen speck. As a result, a tangential stress concentration evolves along the crack’s boundary. With increasing thermal maturity and associated increase of overpressure, the tangential stress around the kerogen speck goes into tension at θ = 0, π/2 and creates a system of horizontal tensile microcracks. The schematic diagram of a horizontal microcrack is shown in Figure 6B. The Rk is the kerogen speck radius, and we assume the crack formed is penny shaped with radius Rc. The w(x) is the crack width that decreases toward the tip. The mathematical model of crack width, w(x), and the associated volume change are explained in Appendix 2. Two nearby kerogen specks connect when their penny-shaped cracks coalesce.
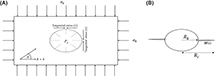 Figure 6. (A) Tangential stress acts along the periphery a speck because of the internal pore pressure (Pp)—as it develops due to kerogen conversion—and local stresses act upon the speck. The stress values are extreme at θ = 0 and θ = π/2. (B) The kerogen speck with a crack. The crack aperture is wx, Rc is the crack radius, and Rk is the radius of the kerogen speck.
The conditions for creating horizontal microcracks depend on the stress concentration along the kerogen’s periphery. The tangential stress, τps, developed in response to local principal stresses σv and σh near a kerogen speck is given by Jaeger et al. (2009) (see also Appendix 3):
where σv is the local overburden stress, σh is the local minimum horizontal stress, β is the angle between the direction of the principal stress, σh, and the horizontal plane, and θ is the angle from the horizontal plane in the counterclockwise direction.
The tangential stress around the periphery of a kerogen speck appears because of the pore pressure, Pp, inside of the speck, and is given by Jaeger et al. (2009):
where τpp is the tangential stress caused by the speck’s internal pore pressure, and α is the aspect ratio, Rk/H, or ellipticity.
The crack is formed at a point on the periphery of the speck, when the hoop stress becomes negative and greater than the tensile strength of the speck according to the condition

where T is the tensile strength of the rock, and τps + τpp is the hoop stress. Figure 7 shows how the principal stresses and pore pressure can initiate horizontal microcracks in kerogen specks. The θ = 0 is the horizontal or bedding-parallel direction, and θ = π/2 is the vertical or bedding-perpendicular direction. The kerogen speck ellipticity is α = 10, the tensile strength is T = 5 MPa, and β = 0. At the low pore pressures (e.g., Pp = 65 and 75 MPa), the hoop stress is minimum (>0) at θ = π/2, and maximum at θ = 0 (the green and blue curves, respectively). At a sufficiently high pore pressure (e.g., Pp = 86 MPa), the hoop stress flips (the red curve), becomes negative at θ = 0 and π, and exceeds the tensile strength of the rock, thus creating a horizontal microcrack. Based on equations 5–7, the specks with ellipticity α > 1 generate horizontal microcracks.
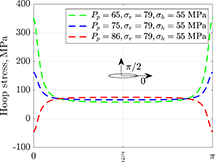 Figure 7. Hoop stresses along the boundary of an elliptical (α = 10) kerogen speck. At high pore pressure (Pp) (Pp = 86 MPa), the hoop stress becomes negative and exceeds the tensile strength of the speck at θ = 0, π, thus creating a horizontal microcrack. σh = horizontal stress; σv = vertical stress.
This conceptual model is valid under the reasonable assumption that the source rock remains impermeable during the kerogen maturation period, thus allowing for pressure buildup within kerogen specks. Additionally, we assume that most of the pore water is squeezed out of the source rock in the early stages of compaction and diagenesis (Korvin, 1984; Smith, 1971), leading to the formation of a disconnected network of fractures/pores in the formation. Most of the kerogen specks in the source rocks become elliptical during burial, but some remain spherical for reasons explained below. As a result, thermal maturation leads to the formation of a connected network of horizontal fractures (imagine many horizontal cookie sheets stacked in vertical layers, with the cookies that overflowed during baking and connected over each layer). A three-dimensional (3-D) connected fracture network requires vertical fractures created by
The overpressure-induced vertical microcracks in still spherical kerogen specks. These specks generate vertical microfractures after horizontal microfractures, in response to kerogen overpressure and stress distribution around the speck surfaces.
The compression-induced fracturing in inorganic layers caused by fluid overpressure in the embedded kerogen-rich layers (Chauve et al., 2020) (see Figure 8). This vertical growth of microfractures in an inorganic layer is caused by localized diffusion of rock damage (Barenblatt and Prostokishin, 1993; Barenblatt et al., 2002, 2006) that is extremely fast compared with growth of the horizontal microfractures that takes millions of years. As a result, vertical microfractures in the inorganic layers are assumed to grow simultaneously with the horizontal microfractures.
 Figure 8. The gray, organic-rich layers with kerogen patches are interbedded with the yellow inorganic layers. High pressure in the organic-rich layers, generated in response to kerogen maturation, increases compressive stress in each inorganic layer from top and bottom. This compression causes rock failure and creates vertical microfractures in the inorganic layers. Vertical fractures also emanate from the spherical kerogen specks. Adapted from Chauve et al. (2020).
The stacked horizontal fracture networks that combine with the vertical cracks in between them create a 3-D rock-spanning cluster that enables the first vertical macroscopic fluid flow (primary hydrocarbon migration) in the source rock.
HYDROCARBON EXPULSION AND CRITICAL POROSITY
Primary hydrocarbon migration in conventional formations is reasonably simple. The fluid ![]() phase
phase![]() and the organic matter are connected during the initial thermal maturation stages. The hydrocarbon saturation at a TR of 0.25 to 0.3 is sufficient to drive the fluid out of the source rock. Also, the very high permeability of the conventional formations leads to an easy escape of the generated hydrocarbon. In contrast, primary expulsion is complex in unconventional formations. In the organic-rich mudrocks, during the initial stages of thermal maturation, kerogen particles are isolated. In other words, a hydraulically continuous and connected fluid flow network does not exist. Keller et al. (2013a) defined the critical porosity, ϕc, as the minimum porosity required for a rock-spanning cluster that enables macroscopic fluid flow in a particular direction. Figure 9 shows the required critical porosity for a rock-spanning cluster in each of the principal directions, x, y, and z. Here x – y represents a bedding-parallel plane in a mudrock sample, and z is the bedding-perpendicular direction. The average value of ϕc in the z direction in a 3-D pore network is larger than 10%. Most mudrocks (clay rich or carbonaceous) around the world retain average porosity of 8% at depth, and we assume that the formation-spanning cluster does not exist in the vertical direction sans macroscopic fractures and microcracks.
and the organic matter are connected during the initial thermal maturation stages. The hydrocarbon saturation at a TR of 0.25 to 0.3 is sufficient to drive the fluid out of the source rock. Also, the very high permeability of the conventional formations leads to an easy escape of the generated hydrocarbon. In contrast, primary expulsion is complex in unconventional formations. In the organic-rich mudrocks, during the initial stages of thermal maturation, kerogen particles are isolated. In other words, a hydraulically continuous and connected fluid flow network does not exist. Keller et al. (2013a) defined the critical porosity, ϕc, as the minimum porosity required for a rock-spanning cluster that enables macroscopic fluid flow in a particular direction. Figure 9 shows the required critical porosity for a rock-spanning cluster in each of the principal directions, x, y, and z. Here x – y represents a bedding-parallel plane in a mudrock sample, and z is the bedding-perpendicular direction. The average value of ϕc in the z direction in a 3-D pore network is larger than 10%. Most mudrocks (clay rich or carbonaceous) around the world retain average porosity of 8% at depth, and we assume that the formation-spanning cluster does not exist in the vertical direction sans macroscopic fractures and microcracks.
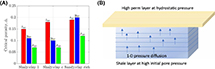 Figure 9. (A) The critical porosity, ϕc, represents the minimum porosity for fluid flow in a particular direction. The z is the bedding-perpendicular direction, and x–y represents the bedding plane. The critical porosity required for percolation (10%–12%) in the z direction is higher than the average porosity of 8% in mudrocks around the world. However, primary hydrocarbon migration occurs in the vertical direction, because of the complex interconnections of natural fractures, rock damage, and microcracks created during kerogen–oil conversion. Once all fractures are blocked with bitumen and pyrobitumen, mostly isolated clusters of the hydrocarbon emerge and migration is limited, leading to an overpressured system. Source: adapted from Keller et al. (2013a). (B) The source rock in contact with the highly permeable layer at the top. Oil starts flowing up through the microcracks created by the overpressure. The expulsion is modeled using a one-dimensional (1-D) pressure diffusion equation. zav, yav, xav = average critical porosity in the z direction, y direction, and x direction, respectively.
Keller et al. (2013b) and Grathoff et al. (2016) also showed that pores in the organic matter in mudrocks are locally well connected at the nanoscale but disconnected at the microscale. Haider et al. (2020a) presented a numerical justification for the existence of disconnected pore networks in source rocks. During the hydrocarbon generation stage, overpressure inside a kerogen speck creates a system of horizontal and vertical microcracks. Once the crack is formed, it grows according to Charles’ law (see Appendix 4) and creates a network of connected vertical and horizontal microcracks. This network bridges the previously disconnected pore clusters and creates a formation-spanning cluster. The formation-spanning cluster eventually connects the source rock layers with the highly permeable flow paths, through which primary hydrocarbon migration develops. Figure 9B shows a schematic diagram of a shale unit overlain by a highly permeable layer. The one-dimensional pressure diffusion equation governing primary oil expulsion in the vertical direction is
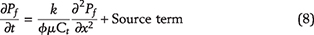
where Pf, k,
 , Ct, and μ are, respectively, the initial pressure of the formation, permeability, porosity, total compressibility, and fluid viscosity. The source term accounts for the kinetics of kerogen–oil conversion as a function of time.
POROSITY AND PERMEABILITY IN THE JAFURAH BASIN
To estimate vertical permeability at the time of primary migration, we start with the experimentally reported horizontal permeability in recovered core and follow the steps listed below. Hakami et al. (2016a) presented a correlation between the horizontal permeability and porosity in the experiments on core samples. From Hakami et al. (2016a), we find that when the core porosity varies from 5% to 7.5%, the measured permeability is between 30 and 150 nd. To estimate the vertical permeability at the time of primary migration, we follow the following reasoning.
Because of release of the confining pressure during core recovery and creation of microfractures, the permeability measured in the laboratory by Hakami et al. (2016a) is likely high in comparison with the in-situ permeability. We assume the in-situ permeability to be an order of magnitude lower (Cho et al., 2013; Heller et al., 2014; Mokhtari and Tutuncu, 2015), resulting in the horizontal permeability of 3 to 15 nd.
Permeability anisotropy is very prominent in shales, and horizontal permeability should be at least one order of magnitude higher than vertical permeability, (Chalmers et al., 2012; Ghanizadeh et al., 2014; Bhandari et al., 2015). Henceforth, we assume that the in-situ vertical permeability may vary between 0.3 and 1.5 nd.
The permeability of mature mudrock cores is lowered significantly by pore blocking from plastic bitumen and brittle pyrobitumen deposited during secondary cracking of oil to gas. Bitumen removal from a core sample using organic solvents increases permeability 10–50 times, depending on weight fraction of the bitumen in the sample. Based on this experimental finding, the in-situ vertical permeability during primary hydrocarbon migration may vary between 1 and 50 nd.
Finally, we assume that the pyrobitumen in the sample decreases permeability by one order of magnitude.
These ![]() considerations
considerations![]() result in the estimated in situ vertical permeability of 10 to 500 nd during primary oil expulsion. Figure 10B schematically illustrates these four steps starting from the range initially reported by Hakami et al. (2016a). We use the final in situ vertical permeability range (10–500 nd) to estimate the velocity and volume of oil expelled from the source rock during primary hydrocarbon expulsion.
result in the estimated in situ vertical permeability of 10 to 500 nd during primary oil expulsion. Figure 10B schematically illustrates these four steps starting from the range initially reported by Hakami et al. (2016a). We use the final in situ vertical permeability range (10–500 nd) to estimate the velocity and volume of oil expelled from the source rock during primary hydrocarbon expulsion.
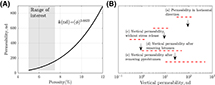 Figure 10. (A) The permeability (k) versus porosity (ϕ) trend for the Jafurah Basin source rock. Source: Hakami et al. (2016a). Critical porosity for the existence of a three-dimensional spanning cluster is 10%–12%. (B) A conceptual framework and the associated steps to estimate the range of vertical permeability in the lower Tuwaiq Mountain source rock.
PORE BLOCKING AND PRESSURE BUILDUP
Primary hydrocarbon migration stops at a minimum oil saturation threshold at which the previously connected oil ![]() phase
phase![]() gets disconnected. Further maturation of the remaining liquid hydrocarbon in the secondary cracking stage leads to the formation of plastic bitumen and brittle pyrobitumen (Bernard et al., 2012; Modica and Lapierre, 2012; Loucks and Reed, 2014). The brittle pyrobitumen deposited in the pore throats is insoluble and immobile. The plastic bitumen is soluble, oil wet, and movable over short distances, thus squeezed into the larger pores and permeable channels, causing a decrease of permeability at all scales up to macroscale (Mastalerz et al., 2013; Xiong et al., 2016; Misch et al., 2019). Pore blocking and the associated permeability decrease lead to the formation of isolated pore clusters.
gets disconnected. Further maturation of the remaining liquid hydrocarbon in the secondary cracking stage leads to the formation of plastic bitumen and brittle pyrobitumen (Bernard et al., 2012; Modica and Lapierre, 2012; Loucks and Reed, 2014). The brittle pyrobitumen deposited in the pore throats is insoluble and immobile. The plastic bitumen is soluble, oil wet, and movable over short distances, thus squeezed into the larger pores and permeable channels, causing a decrease of permeability at all scales up to macroscale (Mastalerz et al., 2013; Xiong et al., 2016; Misch et al., 2019). Pore blocking and the associated permeability decrease lead to the formation of isolated pore clusters.
Eventually, gas generated at higher thermal maturity rises through the plastic bitumen, because of density difference. The velocity of gas bubbles flowing up through the highly viscous plastic bitumen is given by Stokes’ law
where r is the average radius of gas bubbles, g is the acceleration of gravity, ρb and ρg are the bitumen and gas densities, respectively, and μb is the bitumen viscosity.
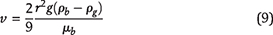
Figure 11A shows the velocity of gas bubbles creeping through the plastic bitumen at different bubble radii. For a bubble radius of 10 nm and the bitumen viscosity range of 100 to 200 poise, the Stokes velocity ranges from 0.5 to 0.9 m/m.y. Figure 11B gives an example of how, in response to this slow escape velocity, the overpressure is preserved in a source rock. The initial gas pressure in the source rock is assumed to be 57 MPa. Even if gas escapes through 10% of the bed’s surface area, the decrease in overpressure is only 10 MPa over 50 m.y. Therefore, the blocking of permeable channels/pore throats by bitumen and pyrobitumen leads to the formation of the mostly isolated gas clusters and controls the gas escape and overpressure buildup/retention in source rocks.
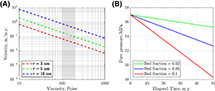 Figure 11. (A) The dashed lines represent the vertical Stokes velocity of gas bubbles that depends on the bitumen viscosity. The shaded region denotes the likely bitumen viscosities. The oil and gas velocities through the bitumen are comparable to the hydrocarbon escape velocity driven by buoyancy. (B) The pore pressure is preserved in a source rock because of the paucity of flow paths for the hydrocarbons. The low velocity of the gas bubbles governed by the Stokes’ law maintains overpressure for a long time. The pore pressure loss as a result of gas escape is only 10 MPa per 50 m.y. if the gas flows through 10% of the bed surface. r = radius of gas bubbles.
In other words, plastic bitumen is an effective blocker of oil and gas migration pathways, and it reduces the effective rock permeability to such an extent that high overpressure can be retained, and the generated oil and gas stored for millions of years.
RESULTS
Based on thermal maturity data and local stress values around a kerogen speck (hoop stress), we predict how overpressure in the kerogen specks leads to microcrack initiation, growth, coalescence, and to a realistic timing of primary hydrocarbon migration after the emergence of a formation-spanning cluster. When maturation started circa 110 Ma, the TMLF depth was only 2.7 km. With time, formation depth increased. The uncertainty in the model caused by the variable depth is addressed in Appendix 5. To simplify the model, calculations are done at 3.5 km true vertical depth, which is the present-day average depth of the Tuwaiq Mountain Formation. We assume that all processes occur at this final depth. The overpressure required to create horizontal microcracks in a kerogen speck depends on the speck’s ellipticity and the state of in situ stress, estimated using equations 5–7. The time required to reach that overpressure is estimated by coupling thermal maturity data with the overpressure generation model. Further, our simulation quantifies residual oil after primary migration and generation of plastic bitumen that blocks most of the pores during secondary cracking of oil to gas and retains the overpressure. The predicted present-day pore pressures compare well with those from the field data reported in the literature. Below, we analyze the variability and uncertainty ranges of some of the critical parameters that govern the physics of our simulation. The goal is to quantify the sensitivity of our model to changes of the key input parameters and ascertain robustness of the results we present, see Appendix 6.
Effect of Kerogen Speck Ellipticity on Crack Initiation Overpressure
The timing of crack initiation and growth depends strongly on kerogen speck ellipticity, α, horizontal distances between the kerogen specks, dh, and the maximum crack radius, Rc (see Figure 12A). Flatter (i.e., more ellipsoidal) kerogen specks grow closer to each other in the bedding plane. As a result, a microcrack’s maximum radius, Rc, decreases, limiting the maximum value of the ratio Rc/Rk. Figure 12B shows the strong effect of ellipticity on the required overpressure, ΔP (pore pressure increment above the hydrostatic pressure), to initiate a horizontal crack. For α P increases sharply, thus requiring more time to reach the critical microfracturing stage (see Figure 13 [blue curve]). The elapsed time required for the cracks to connect depends on the coupling between stress concentration at the crack tips and the distance between kerogen specks (see Figure 13 [red curve]). For the specks with ellipticities 10
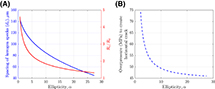 Figure 12. (A) Ellipticity represents flatness of the kerogen specks. Higher ellipticity means flatter kerogen specks and less distance between them (blue curve). The red curve depicts the maximum value of the ratio of the crack radius to the kerogen speck radius, Rc/Rk, when horizontal cracks connect. For flatter kerogen specks (higher α), this ratio decreases, because the kerogen specks are closer to each other. (B) As the kerogen speck ellipticity increases, the initial overpressure required to initiate the horizontal crack decreases. The stress ratio for this simulation is σh/σv = 0.75. σh = horizontal stress; σv = vertical stress; dh = horizontal distance between kerogen specks.
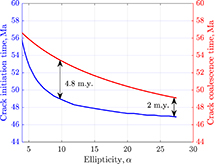 Figure 13. Crack initiation time decreases sharply with α > 0 → 10 because of the high overpressure, ΔP, required for the initiation. The coupled effect of horizontal distance, dh, between kerogen specks and the stress concentration at the crack tips controls the crack coalescence time (red curve). For almost spherical kerogen specks (α h/σv = 0.75. σh = horizontal stress; σv = vertical stress.
Crack Growth Dynamics
With an increase of ellipticity, α, the maximum value of the ratio of crack radius, Rc, to kerogen speck radius, Rk, decreases. This ratio controls the dynamics of crack growth with time. Figure 14A shows the ratio Rc/Rk versus time. When a crack initiates, Rc/Rk jumps abruptly, followed by a modest increase. This sudden jump is caused by an abrupt release of the stress concentrated at the kerogen tips. After this sudden energy release and crack jump, the crack growth stabilizes and is controlled by the kerogen–oil conversion kinetics for most of the crack growth time measured in millions of years. The dynamics of pore pressure change are similar to those of crack growth (see Figure 14B). Once the pressure required for crack initiation is reached, there is a sudden decrease in pressure, A → B, as a result of stress release. This is followed by a slow pressure decrease, B → C, controlled by the kerogen conversion kinetics.
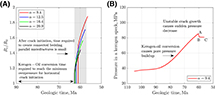 Figure 14. (A) Kerogen specks with lower ellipticity, α, take longer to initiate cracks because of the higher overpressure (ΔP) required for crack initiation. The sudden vertical jump is caused by an abrupt stress release at the kerogen speck’s tips. The kinetics of the kerogen–oil conversion control the growth rates of cracks (the right-curving parts) most of the time. The shaded area represents the time interval required to create connected horizontal microcracks. The stress ratio for this simulation is σh/σv = 0.75. (B) The pressure change in kerogen specks during the kerogen–oil conversion. Point A represents the overpressure required to initiate a horizontal crack followed by a sudden drop because of the unstable crack growth. Then the pressure decreases slowly from point B to point C, eventually creating a connected horizontal microcrack network at point C. The stress ratio for this simulation is σh/σv = 0.75. σh = horizontal stress; σv = vertical stress; Rc/Rk = the ratio of the crack radius to the kerogen speck radius.
Effect of Stress State
Stress plays an important role in creating a connected network of horizontal and vertical microcracks. Using the stress gradient values (Table 1) for the Tuwaiq Mountain Formation at the depth of 3.5 km (11,500 ft) gives an estimated local vertical stress, σv = 87–95 MPa, the minimum horizontal stress range of σh = 68–76 MPa, and the stress ratios, σh/σv, ranging from 0.7 to 0.8 around a kerogen speck.

The overpressure required to create a horizontal microcrack depends strongly on the ellipticity, α, of a kerogen speck (see Figure 15A). With T = 5 MPa, β = 0, and θ = 0, equations 5–7 show that as α increases from 2 to 28, the required overpressure decreases from 75 to 46 MPa. The effect of the stress ratio σh/σv on horizontal microfracturing is negligible. In contrast, the ratio σh/σv significantly impacts vertical microcrack initiation in spherical kerogen specks (α = 1) at T = 5 MPa, β = 0, and θ = π/2. For a small change in the stress ratio from 0.7 to 0.8, the overpressure required to create vertical microcracks increases from 66 to 78 MPa (see Figure 15B). An important implication of this finding is that for higher stress ratios, the possibility of creating an effective vertical microfracture would be appreciably more difficult. This effect can be seen clearly in Figure 16A. The black curve represents the maximum overpressure that can develop in kerogen specks of different ellipticity, posthorizontal microfracturing. The red and blue curves show the pressures needed to generate vertical microcracks at two different stress ratios. For the stress ratio of 0.80, the pore pressure is insufficient to create vertical microcracks (for the same amount of overpressure) compared with the case when the stress ratio is 0.75.
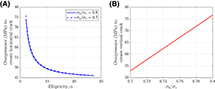 Figure 15. (A) The overpressure required to initiate a horizontal crack is a strong function of the kerogen speck’s ellipticity, α. The effect of stress ratio, σh/σv, is negligible. The overpressure required for crack initiation decreases sharply with ellipticity α > 0 → 10. (B) The overpressure required to create vertical microcracks in spherical kerogen specks (α = 1) depends strongly on the value of σh/σv. σh = horizontal stress; σv = vertical stress.
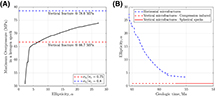 Figure 16. (A) The in situ stress ratio, σh/σv, has a significant effect on the possibility of creating vertical microcracks. Small values (0.6–0.7) of this ratio favor the creation of vertical microcracks under the stress regime that prevails on the Arabian Peninsula. These vertical microcracks are responsible for primary migration of hydrocarbons. (B) The time required to create a connected network of horizontal and vertical microcracks. The horizontal microcracks connected between 65 and 60 Ma. The compression-induced vertical microfractures formed between 65 and 57 Ma. The pore pressure-induced microfractures in spherical kerogen specks formed between 50 and 50 Ma, and the vertical microcracks are created and connect between 55 and 50 Ma for the stress ratio, σh/σv in the range of 0.7–0.75. The connected vertical microcracks led to primary hydrocarbon migration. σh = horizontal stress; σv = vertical stress.
This analysis quantifies the obvious assertion that the quality of fracture connectivity and the probability of percolation depend strongly on the state of stress. The higher the stress ratio, the higher the likelihood is of a more sparsely connected system with a lower efficiency of primary oil migration from the source rock and geologically, a longer maturation period needed to reach the critical overpressure for vertical microfracturing.
Hydrocarbon Expulsion and Overpressure Generation
To quantify the timing and extent of primary migration, we assume that an upper bound on the range of stress ratio is σh/σv = 0.75. The reason is that low differential stress has persisted over geological time in the Tuwaiq Mountain Formation. At this in situ stress condition and for a wide range of kerogen ellipticity, α, horizontal microfractures connected between 65 and 55 Ma. Vertical microfractures formed by the compression-induced damage diffusion in the interbedded inorganic layers and microcrack initiation in the spherical kerogen specks between 57 and 53 Ma. The microcracks induced in the inorganic layers formed along with the horizontal microcracks between 65 and 57 Ma. Beginning at 50 Ma, the sufficiently connected vertical microfractures enabled primary migration (see Figure 16B).
Assuming 50 Ma as the start of vertical migration, Figure 17A shows the expulsion efficiency of the source rock, expressed as a fraction of the total amount of oil available at different vertical permeabilities between 100 and 500 nd. Initially, there was a step increase in the fraction of oil expelled because of the initial high overpressure. Once the overpressure bled off due to low oil compressibility, the fraction of oil expelled increased gradually, driven by the buoyancy force. Assuming a minimum required oil saturation of 30% for the connected oil ![]() phase
phase![]() in primary migration and a vertical permeability of 400 nd, the flow stopped at 30 Ma. At a lower permeability of 100 nd, the primary migration would have never stopped until the present because the minimum oil saturation threshold of 30% has not been reached.
in primary migration and a vertical permeability of 400 nd, the flow stopped at 30 Ma. At a lower permeability of 100 nd, the primary migration would have never stopped until the present because the minimum oil saturation threshold of 30% has not been reached.
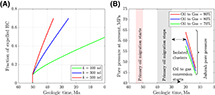 Figure 17. (A) The total hydrocarbon expulsion driven by buoyancy + overpressure at different source rock permeabilities (k). A small decrease of oil volume causes a large pressure drop in the source rock because of the low oil compressibility. As a result, the contribution from overpressure is only 10%, and most of the oil is expelled in a very short period of time (a step increase). (B) The present pore pressure in the Tuwaiq Mountain Formation. The time of emergence of isolated hydrocarbon (HC) clusters is between 20 and 13 Ma. If these clusters formed at 20 Ma, the present-day pore pressure would vary between 57 and 64 MPa. If they had formed at 13 Ma, the present-day pore pressure would vary between 45 and 47 MPa. Depending on the oil-to-gas conversion efficiency and the time when the formation-spanning cluster is disconnected, the present-day pore pressure ranges between 45 and 64 MPa.
The average hydrogen index of 775 mg HC/g TOC in the Tuwaiq Mountain Formation translates into 173 kg HC/t source rock. For a vertical permeability of 400 nd, the total amount of oil expelled from the source rock during primary migration is estimated to be 120 kg/t source rock. The residual oil of 48 kg/t source rock was converted into gas as thermal maturity progressed with time. Since the Tuwaiq Mountain Formation basin bears mostly wet gas, we assume that 70%–90% of the residual oil has been converted into gas, equal to 33.6–43.2 kg/t source rock.
As oil converts to gas and bitumen/pyrobitumen, the latter block permeable channels, and formation permeability decreases continuously with time. However, this permeability is still high, and the produced gas continues to escape from the source rock without increasing pore pressure. When hydrocarbons diffuse slowly through the plastic bitumen, vertical migration is very limited. Gas escape becomes minimal, and the pore pressure starts increasing once isolated clusters of hydrocarbons emerge, circa 20–13 Ma. Figure 17B shows the effect of (1) oil to gas conversion efficiency and (2) the time when the isolated clusters emerge on the present-day overpressure in the Tuwaiq Mountain Formation. The x axis represents the timelines of different processes, and the y axis represents the present-day pore pressure. The oil–gas conversion started at 30 Ma. The red, blue, and green curves show the present-day pore pressures, given the time when isolated clusters formed. For example (red curve), if the isolated clusters formed at 20 Ma, the maximum value of present-day pore pressure would be 64 MPa. As the time of disconnection of the formation-spanning cluster moves to 13 Ma, the maximum pore pressure achieved at present decreases. This is because the source rock has more time to expel a larger amount of gas. Moreover, the steep slopes of the three lines indicate that the final pore pressure is highly sensitive to the time when isolated clusters emerged.
These results highlight that the present-day pore pressure in the Tuwaiq Mountain Formation is a strong function of the time when the isolated hydrocarbon clusters reemerged in the source rock. The simulation results show a fairly wide range of the possible pore pressure values in agreement with the published data, which range between 45 and 65 MPa or 6500 and 9000 psi.
DISCUSSION AND CONCLUSIONS
The analyses and results presented in this study reveal that the economic viability of a source rock depends on (1) the microstructural changes of rock and fluids during thermal evolution of a basin, (2) the paleostress conditions that govern the creation of natural fractures, and (3) the associated permeability changes that enable primary hydrocarbon migration. To simulate primary hydrocarbon migration and generation of overpressure, we combine the elastic rock mechanics with the thermal history of the Tuwaiq Mountain Formation in the Jafurah Basin. Figure 18 summarizes the different geologic, thermal, mechanical, chemical, and transport processes in the source rock and their timing. Primary migration started between 55 and 50 Ma, and stopped at circa 40–30 Ma. Secondary cracking of oil to gas started at 30 Ma. These geologic time intervals are in agreement with the data published by Droste (1990). We estimate the amount of hydrocarbons that migrated from the source rock to be approximately 120 kg oil per metric tonne of source rock. Current pore pressures are very high, 45–65 MPa (6500–9000 psi), Pp/Sv = 0.47–0.7, and explained well by the proposed pore blocking by bitumen and pyrobitumen. In addition, the results of our study reveal that
Kerogen speck ellipticity, α, determines the timing of horizontal crack formation and crack coalescence. Crack growth dynamics are mostly controlled by kerogen→oil kinetics. Horizontal cracks connected between 65 and 55 Ma, depending on the ellipticity of the kerogen specks.
The probability of vertical crack formation in spherical kerogen specks depends strongly on stress ratio, σh/σv. Compression-induced vertical microfractures caused by kerogen-rich fluid layers grow simultaneously with horizontal microfractures.
Low oil compressibility causes a large pore pressure, Pp, change with a small change in oil volume. We find that even large pressure differentials drive only 10%–12% of the total generated hydrocarbons out of the source rock. Most of the oil migrates because of buoyancy.
Vertical gas migration velocity through a pore system filled with plastic bitumen was 0.5–0.9 m/m.y. The reemergence of isolated hydrocarbon clusters in response to pore blocking by plastic bitumen and pyrobitumen limits vertical hydrocarbon flow and develops high overpressure in the source rock.
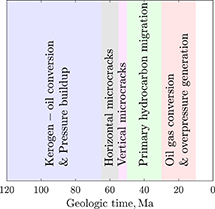 Figure 18. The timing of different processes during thermal maturation of the Tuwaiq Mountain Formation.
In agreement with the Jafurah Basin history, our model explains key processes that govern primary hydrocarbon migration and pressure buildup in the Tuwaiq Mountain source rock formation. However, we recognize that the predictive power of our model is limited by the uncertainties in timing of the relevant processes. These uncertainties are governed by the poorly known rock-mechanical parameters and in situ stress magnitudes over 110 m.y. Appendix 6 and Appendix 7 highlight these effects and their impact on the basin’s state of overpressure.
REFERENCES CITED
Abd El Aal, A., 2017, Identification and characterization of near surface cavities in Tuwaiq Mountain Limestone, Riyadh, KSA, “detection and treatment”: Egyptian Journal of Petroleum, v. 26, no. 1, p. 215–223, doi:10.1016/j.ejpe.2016.04.004.
Adams, A. L., T. J. Nordquist, J. T. Germaine, and P. B. Flemings, 2016, Permeability anisotropy and resistivity anisotropy of mechanically compressed mudrocks: Canadian Geotechnical Journal, v. 53, no. 9, p. 1474–1482, doi:10.1139/cgj-2015-0596.
Al Duhailan, M. A., S. A. Sonnenberg, and L. D. Meckel, 2013, Insights on hydrocarbon-generation microfracturing in organic-rich shales: Society of Petroleum Engineers/AAPG/Society of Exploration Geophysicists Unconventional Resources Technology Conference, Denver, Colorado, August 12–14, 2013, URTEC-1515553-MS, 12 p., doi:10.1190/urtec2013-011.
Alfred, D., and L. Vernik, 2013, A new petrophysical model for organic shales: Petrophysics, v. 54, p. 240–247.
Al-Husseini, M. I., 1997, Jurassic sequence stratigraphy of the western and southern Arabian Gulf: GeoArabia, v. 2, no. 4, p. 361–382, doi:10.2113/geoarabia0204361.
Al-Momin, A., M. Kurdi, S. Baki, K. Mechkak, and A. Al-Saihati, 2015, Proving the concept of unconventional gas reservoirs in Saudi Arabia through multistage fractured horizontal wells: Society of Petroleum Engineers Asia Pacific Unconventional Resources Conference and Exhibition, Brisbane, Australia, November 9–11, 2015, SPE-176844-MS, 14 p., doi:10.2118/176844-MS.
Alsharhan, A. S., and C. G. St. C. Kendall, 1986, Precambrian to Jurassic rocks of Arabian Gulf and adjacent areas: Their facies, depositional setting, and hydrocarbon habitat: AAPG Bulletin, v. 70, no. 8, p. 977–1002.
Ameen, M. S., 2014, Fracture and in-situ stress patterns and impact on performance in the Khuff structural prospects, eastern offshore Saudi Arabia: Marine and Petroleum Geology, v. 50, p. 166–184, doi:10.1016/j.marpetgeo.2013.10.004.
Ameen, M. S., 2019, Borehole imaging of natural fractures and stress indicators in the Jurassic carbonate shale plays, eastern Saudi Arabia: Sixth European Association of Geoscientists and Engineers Shale Workshop, Bordeaux, France, April 28–May 1, 2019, p. 1–5, doi:10.3997/2214-4609.201900317.
Ameen, M. S., I. M. Buhidma, and Z. Rahim, 2010, The function of fractures and in-situ stresses in the Khuff reservoir performance, onshore fields, Saudi Arabia: AAPG Bulletin, v. 94, no. 1, p. 27–60, doi:10.1306/06160909012.
Atkinson, B. K., 1982, Subcritical crack propagation in rocks: Theory, experimental results and applications: Journal of Structural Geology, v. 4, no. 1, p. 41–56, doi:10.1016/0191-8141(82)90005-0.
Ayres, M., M. Bilal, R. Jones, L. Slentz, M. Tartir, and A. Wilson, 1982, Hydrocarbon habitat in main producing areas, Saudi Arabia: AAPG Bulletin, v. 66, no. 1, p. 1–9.
Badawy, A., and F. Horváth, 1999, Recent stress field of the Sinai subplate region: Tectonophysics, v. 304, no. 4, p. 385–403, doi:10.1016/S0040-1951(98)00271-6.
Barenblatt, G. I, M. Bertsch, and C. Nitsch, 2006, Nonlocal damage accumulation and fluid flow in diatomites: Communications in Applied Mathematics and Computational Science, v. 1, no. 1, p. 143–168, doi:10.2140/camcos.2006.1.143.
Barenblatt, G. I., T. Patzek, V. Prostokishin, and D. Silin, 2002, Oil deposits in diatomites: A new challenge for subterranean mechanics: Society of Petroleum Engineers/Department of Energy Improved Oil Recovery Symposium, Tulsa, Oklahoma, April 13–17, 2002, SPE-75230-MS, 9 p., doi:10.2118/75230-MS.
Barenblatt, G. I., and V. M. Prostokishin, 1993, A mathematical model of damage accumulation taking into account microstructural effects: European Journal of Applied Mathematics, v. 4, no. 3, p. 225–240, doi:10.1017/S0956792500001108.
Bartko, K., K. McClelland, A. Sadykov, S. Baki, M. Khalifa, M. Zeghouani, and J. Davis, 2017, Holistic approach to engineered diversion-aided completion providing new method of fracture isolation: Society of Petroleum Engineers Hydraulic Fracturing Technology Conference and Exhibition, The Woodlands, Texas, January 24–26, 2017, SPE-184824-MS, 28 p.
Bernard, S., R. Wirth, A. Schreiber, H. M. Schulz, and B. Horsfield, 2012, Formation of nanoporous pyrobitumen residues during maturation of the Barnett Shale (Fort Worth Basin): International Journal of Coal Geology, v. 103, p. 3–11, doi:10.1016/j.coal.2012.04.010.
Bethke, C. M., 1988, Reply [to “Comment on ‘A numerical model of compaction-driven groundwater flow and heat transfer and its application to the paleohydrology of intracratonic sedimentary basins’ by Craig M. Bethke”]: Journal of Geophysical Research: Solid Earth, v. 93, no. B4, p. 3500–3504, doi:10.1029/JB093iB04p03500.
Beydoun, Z. R., 1991, Arabian plate hydrocarbon geology and potential—A plate tectonic approach: AAPG Studies in Geology 33, 96 p.
Bhandari, A. R., P. B. Flemings, P. J. Polito, M. B. Cronin, and S. L. Bryant, 2015, Anisotropy and stress dependence of permeability in the Barnett shale: Transport in Porous Media, v. 108, no. 2, p. 393–411, doi:10.1007/s11242-015-0482-0.
Bredehoeft, J. D., and B. B. Hanshaw, 1968, On the maintenance of anomalous fluid pressures: I. Thick sedimentary sequences: Geological Society of America Bulletin, v. 79, no. 9, p. 1097–1106, doi:10.1130/0016-7606(1968)79[1097:OTMOAF]2.0.CO;2.
Burrus, J., K. Osadetz, J. Gaulier, E. Brosse, B. Doligez, G. C. de Janvry, J. Barlier, and K. Visser, 1993, Source rock permeability and petroleum expulsion efficiency: Modelling examples from the Mahakam delta, the Williston Basin and the Paris Basin, in J. R. Parker, ed., Petroleum geology of northwest Europe: Geological Society, London, Petroleum Geology Conference Series, v. 4, p. 1317–1332.
Cantrell, D. L., P. G. Nicholson, G. W. Hughes, M. A. Miller, A. G. Buhllar, S. T. Abdelbagi, and A. K. Norton, 2014, Tethyan petroleum systems of Saudi Arabia, in L. Marlow, C. C. G. Kendall, and L. A. Yose, eds., Petroleum systems of the Tethyan region: AAPG Memoir 106, p. 613–639, doi:10.1306/13431867M1063615.
Cardott, B. J., C. R. Landis, and M. E. Curtis, 2015, Post-oil solid bitumen network in the Woodford Shale, USA—A potential primary migration pathway: International Journal of Coal Geology, v. 139, p. 106–113, doi:10.1016/j.coal.2014.08.012.
Carrigan, W. J., G. A. Cole, E. L. Colling, and P. J. Jones, 1995, Geochemistry of the Upper Jurassic Tuwaiq Mountain and Hanifa Formation petroleum source rocks of eastern Saudi Arabia, in B. J. Katz, ed., Petroleum source rocks: Berlin/Heidelberg, Germany, Springer Casebooks in Earth Sciences, p. 67–87, doi:10.1007/978-3-642-78911-3_5.
Carslaw, H. S., and J. C. Jaeger, 1959, Conduction of heat in solids, 2nd ed.: Oxford, United Kingdom, Clarendon Press, 510 p.
Chalmers, G. R., D. J. Ross, and R. M. Bustin, 2012, Geological controls on matrix permeability of Devonian gas shales in the Horn River and Liard Basins, northeastern British Columbia, Canada: International Journal of Coal Geology, v. 103, p. 120–131, doi:10.1016/j.coal.2012.05.006.
Charles, R. J., 1958, Static fatigue of glass. I: Journal of Applied Physics, v. 29, no. 11, p. 1549–1553, doi:10.1063/1.1722991.
Chauve, T., L. Scholtes, F. V. Donzé, N. Haque Mondol, and F. Renard, 2020, Layering in shales controls microfracturing at the onset of primary migration in source rocks: Journal of Geophysical Research: Solid Earth, v. 125, no. 5, e2020JB019444, 19 p., doi:10.1029/2020JB019444.
Cho, Y., O. G. Apaydin, and E. Ozkan, 2013, Pressure-dependent natural-fracture permeability in shale and its effect on shale-gas well production: Society of Petroleum Engineers Reservoir Evaluation & Engineering, v. 16, no. 2, p. 216–228, doi:10.2118/159801-PA.
Cole, G., W. J. Carrigan, E. L. Colling, H. Halpern, M. Al-Khadhrawi, and P. J. Jones, 1994, The organic geochemistry of the Jurassic petroleum system in eastern Saudi Arabia, in A. F. Embry, B. Beauchamp, and D. J. Glass, eds., Pangea: Global environments and resources: Calgary, Alberta, Canada, Canadian Society of Petroleum Geologists Memoir 17, p. 413–438.
Craddock, P. R., T. V. Le Doan, K. Bake, M. Polyakov, A. M. Charsky, and A. E. Pomerantz, 2015, Evolution of kerogen and bitumen during thermal maturation via semi-open pyrolysis investigated by infrared spectroscopy: Energy & Fuels, v. 29, no. 4, p. 2197–2210, doi:10.1021/ef5027532.
Curtis, M. E., B. J. Cardott, C. H. Sondergeld, and C. S. Rai, 2012, Development of organic porosity in the Woodford Shale with increasing thermal maturity: International Journal of Coal Geology, v. 103, p. 26–31, doi:10.1016/j.coal.2012.08.004.
David, C., T. F. Wong, W. Zhu, and J. Zhang, 1994, Laboratory measurement of compaction-induced permeability change in porous rocks: Implications for the generation and maintenance of pore pressure excess in the crust: Pure and Applied Geophysics, v. 143, no. 1–3, p. 425–456, doi:10.1007/BF00874337.
Deming, D., 1994, Factors necessary to define a pressure seal: AAPG Bulletin, v. 78, no. 6, p. 1005–1009.
Dewhurst, D. N., A. C. Aplin, J. P. Sarda, and Y. Yang, 1998, Compaction-driven evolution of porosity and permeability in natural mudstones: An experimental study: Journal of Geophysical Research: Solid Earth, v. 103, no. B1, p. 651–661, doi:10.1029/97JB02540.
Dong, D., Z. Shi, S. Sun, C. Guo, C. Zhang, W. Guo, Q. Guan, , 2018, Factors controlling microfractures in black shale: A case study of Ordovician Wufeng Formation–Silurian Longmaxi Formation in Shuanghe profile, Changning area, Sichuan Basin, SW China: Petroleum Exploration and Development, v. 45, no. 5, p. 818–829, doi:10.1016/S1876-3804(18)30085-5.
Dong, F., Z. Feng, D. Yang, Y. Zhao, and D. Elsworth, 2018, Permeability evolution of pyrolytically-fractured oil shale under in situ conditions: Energies, v. 11, no. 11, 3033, 9 p., doi:10.3390/en11113033.
Droste, H., 1990, Depositional cycles and source rock development in an epeiric intra-platform basin: The Hanifa Formation of the Arabian peninsula: Sedimentary Geology, v. 69, no. 3–4, p. 281–296, doi:10.1016/0037-0738(90)90054-W.
Eftekhari, B., M. Marder, and T. W. Patzek, 2018, Field data provide estimates of effective permeability, fracture spacing, well drainage area and incremental production in gas shales: Journal of Natural Gas Science and Engineering, v. 56, p. 141–151, doi:10.1016/j.jngse.2018.05.027.
Eftekhari, B., M. Marder, and T. W. Patzek, 2020, Estimation of effective permeability, fracture spacing, drainage area, and incremental production from field data in gas shales with nonnegligible sorption: Society of Petroleum Engineers Reservoir Evaluation & Engineering, v. 23, no. 2, p. 664–683, doi:10.2118/199891-PA.
El-Sorogy, A. S., S. A. Almadani, and M. E. Al-Dabbagh, 2016, Microfacies and diagenesis of the reefal limestone, Callovian Tuwaiq Mountain Limestone Formation, central Saudi Arabia: Journal of African Earth Sciences, v. 115, p. 63–70, doi:10.1016/j.jafrearsci.2015.12.013.
Er, C., Y. Li, J. Zhao, R. Wang, Z. Bai, and Q. Han, 2016, Pore formation and occurrence in the organic-rich shales of the Triassic Chang-7 Member, Yanchang Formation, Ordos Basin, China: Journal of Natural Gas Geoscience, v. 1, no. 6, p. 435–444, doi:10.1016/j.jnggs.2016.11.013.
Fan, Z. Q, Z. H. Jin, and S. E. Johnson, 2012a, Gas-driven subcritical crack propagation during the conversion of oil to gas: Petroleum Geoscience, v. 18, no. 2, p. 191–199, doi:10.1144/1354-079311-030.
Fan, Z. Q., Z. H. Jin, and S. E. Johnson, 2012b, Modelling petroleum migration through microcrack propagation in transversely isotropic source rocks: Geophysical Journal International, v. 190, no. 1, p. 179–187, doi:10.1111/j.1365-246X.2012.05516.x.
Ferri, F., A. S. Hickin, and D. H. Huntley, 2011, Geochemistry and shale gas potential of the Garbutt Formation, Liard Basin, British Columbia: Victoria, Canada, British Columbia Ministry of Energy and Mines Geoscience Reports 2011, p. 19–36.
Fishman, N., J. M. Guthrie, and M. Honarpour, 2014, Development of organic and inorganic porosity in the Cretaceous Eagle Ford Formation, south Texas: AAPG Search and Discovery article 50928, accessed January 15, 2023, https://www.searchanddiscovery.com/documents/2014/50928fishman/ndx_fishman.pdf.
Gasparik, M., P. Bertier, Y. Gensterblum, A. Ghanizadeh, B. M. Krooss, and R. Littke, 2014, Geological controls on the methane storage capacity in organic-rich shales: International Journal of Coal Geology, v. 123, p. 34–51, doi:10.1016/j.coal.2013.06.010.
Ghanizadeh, A., A. Amann-Hildenbrand, M. Gasparik, Y. Gensterblum, B. M. Krooss, and R. Littke, 2014, Experimental study of fluid transport processes in the matrix system of the European organic-rich shales: II. Posidonia Shale (Lower Toarcian, northern Germany): International Journal of Coal Geology, v. 123, p. 20–33, doi:10.1016/j.coal.2013.06.009.
Gorynski, K. E., M. H. Tobey, D. A. Enriquez, T. M. Smagala, J. L. Dreger, and R. E. Newhart, 2019, Quantification and characterization of hydrocarbon-filled porosity in oil-rich shales using integrated thermal extraction, pyrolysis, and solvent extraction: AAPG Bulletin, v. 103, no. 3, p. 723–744, doi:10.1306/08161817214.
Grathoff, G. H., M. Peltz, F. Enzmann, and S. Kaufhold, 2016, Porosity and permeability determination of organic-rich Posidonia shales based on 3-D analyses by FIB-SEM microscopy: Solid Earth, v. 7, no. 4, p. 1145–1156, doi:10.5194/se-7-1145-2016.
Grohmann, S., R. Littke, I. Abu-Mahfouz, G. Gaus, J. Klaver, N. Thüns, P. Schulte, T. Patzek, and V. Vahrenkamp, 2023, The deposition of type II-S Jordan oil shale in the context of Late Cretaceous source rock formation in the Eastern Mediterranean realm. Insights from organic and inorganic geochemistry and petrography: Marine and Petroleum Geology, v. 148, 106058, 31 p., doi:10.1016/j.marpetgeo.2022.106058.
Gu, X., D. F. Mildner, D. R. Cole, G. Rother, R. Slingerland, and S. L. Brantley, 2016, Quantification of organic porosity and water accessibility in Marcellus shale using neutron scattering: Energy & Fuels, v. 30, no. 6, p. 4438–4449, doi:10.1021/acs.energyfuels.5b02878.
Guo, H., W. Jia, J. Zeng, and R. He, 2017, Evolution of organic matter and nanometer-scale pores in an artificially matured shale undergoing two distinct types of pyrolysis: A study of the Yanchang Shale with type II kerogen: Organic Geochemistry, v. 105, p. 56–66, doi:10.1016/j.orggeochem.2017.01.004.
Guo, X., S. He, K. Liu, and L. Zheng, 2011, Quantitative estimation of overpressure caused by oil generation in petroliferous basins: Organic Geochemistry, v. 42, no. 11, p. 1343–1350, doi:10.1016/j.orggeochem.2011.08.017.
Guo, X. W., K. Y. Liu, S. He, Z. Yang, and T. Dong, 2016, Quantitative estimation of overpressure caused by gas generation and application to the Baiyun Depression in the Pearl River Mouth Basin, South China Sea: Geofluids, v. 16, no. 1, p. 129–148, doi:10.1111/gfl.12140.
Hackley, P. C., and B. J. Cardott, 2016, Application of organic petrography in North American shale petroleum systems: A review: International Journal of Coal Geology, v. 163, p. 8–51, doi:10.1016/j.coal.2016.06.010.
Haider, S., and T. W. Patzek, 2020, A physics based model of enhanced gas production in mudrocks: Society of Petroleum Geologists/AAPG/Society of Exploration Geophysicists Unconventional Resources Technology Conference, Virtual, July 20–22, 2020, URTEC-2020-2985-MS, 22 p., doi:10.15530/urtec-2020-2985.
Haider, S., W. Saputra, and T. Patzek, 2020, The key factors that determine the economically viable, horizontal hydrofractured gas wells in mudrocks: Energies, v. 13, no. 9, 2348, 22 p., doi:10.3390/en13092348.
Hakami, A., A. Al-Mubarak, K. Al-Ramadan, C. Kurison, and I. Leyva, 2016a, Characterization of carbonate mudrocks of the Jurassic Tuwaiq Mountain Formation, Jafurah Basin, Saudi Arabia: Implications for unconventional reservoir potential evaluation: Journal of Natural Gas Science and Engineering, v. 33, p. 1149–1168, doi:10.1016/j.jngse.2016.04.009.
Hakami, A., L. Ellis, K. Al-Ramadan, and S. Abdelbagi, 2016b, Mud gas isotope logging application for sweet spot identification in an unconventional shale gas play: A case study from Jurassic carbonate source rocks in Jafurah Basin, Saudi Arabia: Marine and Petroleum Geology, v. 76, p. 133–147, doi:10.1016/j.marpetgeo.2016.05.003.
Hakami, A., and S. İnan, 2016, A basin modeling study of the Jafurah Sub-Basin, Saudi Arabia: Implications for unconventional hydrocarbon potential of the Jurassic Tuwaiq Mountain Formation: International Journal of Coal Geology, v. 165, p. 201–222, doi:10.1016/j.coal.2016.08.019.
Hakami, A. M. H., 2016, Characterization of the carbonate mud rocks of the Middle Jurassic Tuwaiq Mountain formation, Jafurah sub-basin, Saudi Arabia; Implication for unconventional reservoir quality prediction, Ph.D. thesis, King Fahd University of Petroleum and Mining, Dhahran, Saudi Arabia, 235 p.
Han, X., X. Jiang, L. Yu, and Z. Cui, 2006, Change of pore structure of oil shale particles during combustion. Part 1. Evolution mechanism: Energy & Fuels, v. 20, no. 6, p. 2408–2412, doi:10.1021/ef0603277.
Helgeson, H. C., L. Richard, W. F. McKenzie, D. L. Norton, and A. Schmitt, 2009, A chemical and thermodynamic model of oil generation in hydrocarbon source rocks: Geochimica et Cosmochimica Acta, v. 73, no. 3, p. 594–695, doi:10.1016/j.gca.2008.03.004.
Heller, R., J. Vermylen, and M. Zoback, 2014, Experimental investigation of matrix permeability of gas shales: AAPG Bulletin, v. 98, no. 5, p. 975–995, doi:10.1306/09231313023.
Hooker, J., I. Abu-Mahfouz, Q. Meng, and J. Cartwright, 2019, Fractures in mudrocks: Advances in constraining timing and understanding mechanisms: Journal of Structural Geology, v. 125, p. 166–173, doi:10.1016/j.jsg.2018.04.020.
Jaeger, J. C., N. G. W. Cook, and R. Zimmerman, 2009, Fundamentals of rock mechanics: Hoboken, New Jersey, John Wiley & Sons, 488 p.
Jarvie, D. M., 2012, Shale resource systems for oil and gas: Part 2–Shale-oil resource systems, in J. A. Breyer, ed., Shale reservoirs—Giant resources for the 21st century: AAPG Memoir 97, p. 69–87.
Jin, L., R. Mathur, G. Rother, D. Cole, E. Bazilevskaya, J. Williams, A. Carone, and S. Brantley, 2013, Evolution of porosity and geochemistry in Marcellus Formation black shale during weathering: Chemical Geology, v. 356, p. 50–63, doi:10.1016/j.chemgeo.2013.07.012.
Katsube, T. J., 2000, Shale permeability and pore-structure evolution characteristics: Ottawa, Canada, Natural Resources Canada, Geological Survey of Canada Current Research No. 2000-E15, 9 p., doi:10.4095/211622.
Katsube, T. J., M. Williamson, and M. E. Best, 1992, Shale pore structure evolution and its effect on permeability: Society of Professional Well Log Analysts 33rd Annual Symposium, Oklahoma City, Oklahoma, June 14–17, 1992, p. 1–22.
Katz, B. J., ed., 2012, Petroleum source rocks: Berlin/Heidelberg, Germany, Springer Casebooks in Earth Sciences, 329 p.
Keller, L. M., and L. Holzer, 2018, Image-based upscaling of permeability in Opalinus Clay: Journal of Geophysical Research: Solid Earth, v. 123, no. 1, p. 285–295, doi:10.1002/2017JB014717.
Keller, L. M., L. Holzer, P. Schuetz, and P. Gasser, 2013a, Pore space relevant for gas permeability in Opalinus Clay: Statistical analysis of homogeneity, percolation, and representative volume element: Journal of Geophysical Research: Solid Earth, v. 118, no. 6, p. 2799–2812, doi:10.1002/jgrb.50228.
Keller, L. M., P. Schuetz, R. Erni, M. D. Rossell, F. Lucas, P. Gasser, and L. Holzer, 2013b, Characterization of multi-scale microstructural features in Opalinus Clay: Microporous and Mesoporous Materials, v. 170, p. 83–94, doi:10.1016/j.micromeso.2012.11.029.
Kibodeaux, K. R., 2014, Evolution of porosity, permeability, and fluid saturations during thermal conversion of oil shale: Society of Petroleum Engineers Annual Technical Conference and Exhibition, Amsterdam, the Netherlands, October, 27–29, 2014, SPE-170733-MS, 10 p., doi:10.2118/170733-MS.
Klaver, J., G. Desbois, R. Littke, and J. L. Urai, 2015, BIB-SEM characterization of pore space morphology and distribution in postmature to overmature samples from the Haynesville and Bossier Shales: Marine and Petroleum Geology, v. 59, p. 451–466, doi:10.1016/j.marpetgeo.2014.09.020.
Klaver, J., G. Desbois, R. Littke, and J. L. Urai, 2016, BIB-SEM pore characterization of mature and post mature Posidonia Shale samples from the Hils area, Germany: International Journal of Coal Geology, v. 158, p. 78–89, doi:10.1016/j.coal.2016.03.003.
Ko, L. T., R. G. Loucks, T. Zhang, S. C. Ruppel, and D. Shao, 2016, Pore and pore network evolution of Upper Cretaceous Boquillas (Eagle Ford–equivalent) mudrocks: Results from gold tube pyrolysis experiments: AAPG Bulletin, v. 100, no. 11, p. 1693–1722, doi:10.1306/04151615092.
Kobchenko, M., A. Hafver, E. Jettestuen, F. Renard, O. Galland, B. Jamtveit, P. Meakin, and D. K. Dysthe, 2014, Evolution of a fracture network in an elastic medium with internal fluid generation and expulsion: Physical Review E, v. 90, no. 5, 052801, 9 p., doi:10.1103/PhysRevE.90.052801.
Kobchenko, M., H. Panahi, F. Renard, D. K. Dysthe, A. Malthe-Sørenssen, A. Mazzini, J. Scheibert, B. Jamtveit, and P. Meakin, 2011, 4D imaging of fracturing in organic-rich shales during heating: Journal of Geophysical Research: Solid Earth, v. 116, no. B12, 9 p., doi:10.1029/2011JB008565.
Korvin, G., 1984, Shale compaction and statistical physics: Geophysical Journal International, v. 78, no. 1, p. 35–50, doi:10.1111/j.1365-246X.1984.tb06470.x.
Lash, G. G., and T. Engelder, 2005, An analysis of horizontal microcracking during catagenesis: Example from the Catskill delta complex: AAPG Bulletin, v. 89, no. 11, p. 1433–1449, doi:10.1306/05250504141.
Lewan, M., and T. Ruble, 2002, Comparison of petroleum generation kinetics by isothermal hydrous and nonisothermal open-system pyrolysis: Organic Geochemistry, v. 33, no. 12, p. 1457–1475, doi:10.1016/S0146-6380(02)00182-1.
Leythaeuser, D., R. Littke, M. Radke, and R. Schaefer, 1988, Geochemical effects of petroleum migration and expulsion from Toarcian source rocks in the Hils syncline area, NW-Germany, in L. Mattavelli and L. Novelli, eds., Organic geochemistry in petroleum exploration: New York, Elsevier, p. 489–502, doi:10.1016/B978-0-08-037236-5.50056-7.
Leythaeuser, D., A. Mackenzie, R. G. Schaefer, and M. Bjorøy, 1984, A novel approach for recognition and quantification of hydrocarbon migration effects in shale-sandstone sequences: AAPG Bulletin, v. 68, no. 2, p. 196–219.
Lin, B., M. Chen, Y. Jin, and H. Pang, 2015, Modeling pore size distribution of southern Sichuan shale gas reservoirs: Journal of Natural Gas Science and Engineering, v. 26, p. 883–894, doi:10.1016/j.jngse.2015.07.032.
Littke, R., 1993, Deposition, diagenesis and weathering of organic matter-rich sediments: Berlin Heidelberg, Springer-Verlag, Lecture Notes in Earth Sciences 47, 216 p.
Littke, R., D. Baker, and D. Leythaeuser, 1988, Microscopic and sedimentological evidence for the generation and migration of hydrocarbons in Toarcian source rocks of different maturities: in L. Mattavelli and L. Novelli, eds., Organic geochemistry in petroleum exploration: New York, Elsevier, p. 549–559.
Loucks, R. G., and R. M. Reed, 2014, Scanning-electron-microscope petrographic evidence for distinguishing organic-matter pores associated with depositional organic matter versus migrated organic matter in mudrock (abs.): Gulf Coast Association of Geological Societies and the Gulf Coast Section of SEPM 64th Annual Convention, Lafayette, Louisiana, October 5–7, 2014, accessed October 18, 2020, https://www.searchanddiscovery.com/abstracts/html/2014/90196gcags/abstracts/91.html.
Luo, Y., and M. B. Dusseault, 1997, Determination and prediction of thermodynamically-controlled micro-fracture zones in organic-matter rich rocks: International Journal of Rock Mechanics and Mining Sciences, v. 34, p. 183.e1–183.e10.
MacPherson, K. A. T., and M. S. Ameen, 2014, Fractures in the Jurassic Arab Formation and Lower Fadhili carbonate member of the Dhruma Formation, Saudi Arabia: 76th European Association of Geoscientists and Engineers Conference and Exhibition, Amsterdam, the Netherlands, June 16–19, 2014, p. 1–5.
Marquez, X. M., and E. W. Mountjoy, 1996, Microfractures due to overpressures caused by thermal cracking in well-sealed Upper Devonian reservoirs, deep Alberta Basin: AAPG Bulletin, v. 80, no. 4, p. 570–588.
Mastalerz, M., A. Schimmelmann, A. Drobniak, and Y. Chen, 2013, Porosity of Devonian and Mississippian New Albany Shale across a maturation gradient: Insights from organic petrology, gas adsorption, and mercury intrusion: AAPG Bulletin, v. 97, no. 10, p. 1621–1643, doi:10.1306/04011312194.
Mathia, E. J., L. Bowen, K. M. Thomas, and A. C. Aplin, 2016, Evolution of porosity and pore types in organic-rich, calcareous, Lower Toarcian Posidonia Shale: Marine and Petroleum Geology, v. 75, p. 117–139, doi:10.1016/j.marpetgeo.2016.04.009.
Misch, D., D. Gross, G. Hawranek, B. Horsfield, J. Klaver, F. Mendez-Martin, J. Urai, , 2019, Solid bitumen in shales: Petrographic characteristics and implications for reservoir characterization: International Journal of Coal Geology, v. 205, p. 14–31, doi:10.1016/j.coal.2019.02.012.
Modica, C. J., and S. G. Lapierre, 2012, Estimation of kerogen porosity in source rocks as a function of thermal transformation: Example from the Mowry Shale in the Powder River Basin of Wyoming: AAPG Bulletin, v. 96, no. 1, p. 87–108, doi:10.1306/04111110201.
Mokhtari, M., and A. N. Tutuncu, 2015, Characterization of anisotropy in the permeability of organic-rich shales: Journal of Petroleum Science Engineering, v. 133, p. 496–506, doi:10.1016/j.petrol.2015.05.024.
Murris, R. J., 1980, Middle East: Stratigraphic evolution and oil habitat: AAPG Bulletin, v. 64, no. 5, p. 597–618.
Neuzil, C. E., 1986, Groundwater flow in low-permeability environments: Water Resources Research, v. 22, no. 8, p. 1163–1195, doi:10.1029/WR022i008p01163.
Neuzil, C. E., 1994, How permeable are clays and shales?: Water Resources Research, v. 30, no. 2, p. 145–150, doi:10.1029/93WR02930.
Nilson, R. H., and W. J. Proffer, 1984, Engineering formulas for fractures emanating from cylindrical and spherical holes: Journal of Applied Mechanics, v. 51, no. 4, p. 929–933, doi:10.1115/1.3167748.
O’Brien, N. R., M. D. Cremer, and D. G. Canales, 2002, The role of argillaceous rock fabric in primary migration of oil: Gulf Coast Association of Geological Societies Transactions, v. 52, p. 1103–1112.
Ostermeier, R. M., 2001, Compaction effects on porosity and permeability: Deepwater Gulf of Mexico turbidite: Journal of Petroleum Technology, v. 53, no. 2, p. 68–74, doi:10.2118/66479-JPT.
Ougier-Simonin, A., F. Renard, C. Boehm, and S. Vidal-Gilbert, 2016, Microfracturing and microporosity in shales: Earth-Science Reviews, v. 162, p. 198–226, doi:10.1016/j.earscirev.2016.09.006.
Özkaya, I., 1988, A simple analysis of oil-induced fracturing in sedimentary rocks: Marine and Petroleum Geology, v. 5, no. 3, p. 293–297, doi:10.1016/0264-8172(88)90008-6.
Padin, A., A. N. Tutuncu, and S. Sonnenberg, 2014, On the mechanisms of shale microfracture propagation: Society of Petroleum Engineers Hydraulic Fracturing Technology Conference, The Woodlands, Texas, February 4–6, 2014, SPE-168624-MS, 29 p.
Panahi, H., M. Kobchenko, P. Meakin, D. K. Dysthe, and F. Renard, 2019, Fluid expulsion and microfracturing during the pyrolysis of an organic rich shale: Fuel, v. 235, p. 1–16, doi:10.1016/j.fuel.2018.07.069.
Panahi, H., M. Kobchenko, F. Renard, A. Mazzini, J. Scheibert, D. K. Dysthe, B. Jamtveit, A. Malthe-Sørenssen, and P. Meakin, 2014, A 4D synchrotron x-ray tomography study of the formation of hydrocarbon migration pathways in heated organic-rich shale, arXiv abs/1401.2448, 12 p., accessed January 18, 2023, doi:10.48550/arXiv.1401.2448.
Patzek, T., F. Male, and M. Marder, 2014, A simple model of gas production from hydrofractured horizontal wells in shales: AAPG Bulletin, v. 98, no. 12, p. 2507–2529, doi:10.1306/03241412125.
Patzek, T. W., F. Male, and M. Marder, 2013, Gas production in the Barnett Shale obeys a simple scaling theory: Proceedings of the National Academy of Sciences of the United States of America, v. 110, no. 49, p. 19731–19736, doi:10.1073/pnas.1313380110.
Patzek, T. W., W. Saputra, W. Kirati, and M. Marder, 2019, Generalized extreme value statistics, physical scaling, and forecasts of gas production in the Barnett Shale: Energy & Fuels, v. 33, no. 12, p. 12154–12169, doi:10.1021/acs.energyfuels.9b01385.
Pommer, M., and K. Milliken, 2015, Pore types and pore-size distributions across thermal maturity, Eagle Ford Formation, southern Texas: AAPG Bulletin, v. 99, no. 9, p. 1713–1744, doi:10.1306/03051514151.
Powers, R. W., L. F. Ramirez, C. D. Redmond, and E. L. Elberg, 1966, Geology of the Arabian peninsula: Sedimentary geology of Saudi Arabia: Washington, DC, US Geological Survey Professional Paper 560, 147 p.
Rabbani, A., T. G. Baychev, S. Ayatollahi, and A. P. Jivkov, 2017, Evolution of pore-scale morphology of oil shale during pyrolysis: A quantitative analysis: Transport in Porous Media, v. 119, no. 1, p. 143–162, doi:10.1007/s11242-017-0877-1.
Saidian, M., U. Kuila, S. Rivera, L. J. Godinez, and M. Prasad, 2014, Porosity and pore size distribution in mudrocks: A comparative study for Haynesville, Niobrara, Monterey and Eastern European Silurian Formations: Society of Petroleum Engineers/AAPG/Society of Exploration Geophysicists Unconventional Resources Technology Conference, Denver, Colorado, August 25–27, 2014, URTEC-1922745-MS, 13 p.
Saif, T., Q. Lin, Y. Gao, Y. Al-Khulaifi, F. Marone, D. Hollis, M. J. Blunt, and B. Bijeljic, 2019, 4D in situ synchrotron x-ray tomographic microscopy and laser-based heating study of oil shale pyrolysis: Applied Energy, v. 235, p. 1468–1475, doi:10.1016/j.apenergy.2018.11.044.
Saputra, W., W. Kirati, and T. Patzek, 2019, Generalized extreme value statistics, physical scaling and forecasts of oil production in the Bakken Shale: Energies, v. 12, no. 19, 3641, 24 p., doi:10.3390/en12193641.
Saputra, W., W. Kirati, and T. Patzek, 2020, Physical scaling of oil production rates and ultimate recovery from all horizontal wells in the Bakken Shale: Energies, v. 13, no. 8, 2052, 29 p., doi:10.3390/en13082052.
Saputra, W., W. Kirati, and T. Patzek, 2022a, Forecast of economic tight oil and gas production in Permian Basin: Energies, v. 15, no. 1, 43, 22 p., doi:10.3390/en15010043.
Saputra, W., W. Kirati, and T. Patzek, 2022b, Generalized extreme value statistics, physical scaling and forecasts of oil production from all vertical wells in the Permian Basin: Energies, v. 15, no. 3, 904, 23 p., doi:10.3390/en15030904.
Schutjens, P. M. T. M., T. H. Hanssen, M. H. H. Hettema, J. Merour, P. de Bree, J. W. A. Coremans, and G. Helliesen, 2004, Compaction-induced porosity/permeability reduction in sandstone reservoirs: Data and model for elasticity-dominated deformation: SPE Reservoir Evaluation & Engineering, v. 7, no. 3, p. 202–216, doi:10.2118/88441-PA.
Siddiqui, F. I., and L. W. Lake, 1992, A dynamic theory of hydrocarbon migration: Mathematical Geology, v. 24, no. 3, p. 305–327, doi:10.1007/BF00893752.
Smith, J., 1971, The dynamics of shale compaction and evolution of pore-fluid pressures: Journal of the International Association for Mathematical Geology, v. 3, no. 3, p. 239–263, doi:10.1007/BF02045794.
Sorkhabi, R., 2019, Shale plays of the Middle East: GEO ExPro, v. 16, no. 5, p. 30–37.
Steineke, M., R. A. Bramkamp, and N. Sander, 1958, Stratigraphic relations of Arabian Jurassic oil: Middle East, in L. G. Weeks, ed., Habitat of oil: AAPG Special Publication 18, p. 1294–1329.
Sun, L., J. Tuo, M. Zhang, C. Wu, Z. Wang, and Y. Zheng, 2015, Formation and development of the pore structure in Chang 7 member oil-shale from Ordos Basin during organic matter evolution induced by hydrous pyrolysis: Fuel, v. 158, p. 549–557, doi:10.1016/j.fuel.2015.05.061.
Teixeira, M. G., F. Donzé, F. Renard, H. Panahi, E. Papachristos, and L. Scholtès, 2017, Microfracturing during primary migration in shales: Tectonophysics, v. 694, p. 268–279, doi:10.1016/j.tecto.2016.11.010.
Tissot, B. P., and D. H. Welte, 1984, From kerogen to petroleum, in Petroleum formation and occurrence: Berlin Heidelberg, Germany, Springer, p. 160–198, doi:10.1007/978-3-642-87813-8_10.
Tong, X., G. Zhang, Z. Wang, Z. Wen, Z. Tian, H. Wang, F. Ma, and Y. Wu, 2018, Distribution and potential of global oil and gas resources: Petroleum Exploration and Development, v. 45, no. 4, p. 779–789, doi:10.1016/S1876-3804(18)30081-8.
Tsai, Y., 1969, Stress distributions in elastic and viscoelastic plates subjected to symmetrical rigid indentations: Quarterly of Applied Mathematics, v. 27, no. 3, p. 371–380, doi:10.1090/qam/99818.
Tsai, Y., 1982, Penny-shaped crack in a transversely isotropic plate of finite thickness: International Journal of Fracture, v. 20, no. 2, p. 81–89, doi:10.1007/BF01141258.
Uchida, T., 1987, Pore-size distributions and the evaluation of permeability in reservoir rocks–A proposal of empirical expressions with regard to petrological properties of pores: Journal of the Japanese Association for Petroleum Technology, v. 52, no. 1, p. 1–11, doi:10.3720/japt.52.1.
Ungerer, P., F. Behar, and D. Discamps, 1981, Tentative calculation of overall volume of organic matter: Implications for primary migration, in M. Bjorøy, ed., Advances in organic geochemistry, New York, Wiley, p. 129–135.
US Energy Information Administration, 2019, International energy outlook 2019 with projections to 2050, accessed May 21, 2023, https://www.eia.gov/outlooks/ieo/pdf/ieo2019.pdf.
Vernik, L., 1994, Hydrocarbon generation-induced microcracking of source rocks: Geophysics, v. 59, no. 4, p. 555–563, doi:10.1190/1.1443616.
Wiederhorn, S., 1978, Mechanisms of subcritical crack growth in glass: Fracture Mechanics of Ceramics, v. 4, p. 549–580.
Wilson, A. O., 2020, Structural development of the Arabian Intrashelf Basin region, in A. O. Wilson, ed., The Middle and Late Jurassic Intrashelf Basin of the eastern Arabian Peninsula: Geological Society, London, Memoirs, v. 53, p. 21–35.
Wu, S., R. Zhu, J. Cui, J. Cui, B. Bai, X. Zhang, X. Jin, D. Zhu, J. You, and X. Li, 2015, Characteristics of lacustrine shale porosity evolution, Triassic Chang 7 member, Ordos Basin, NW China: Petroleum Exploration and Development, v. 42, no. 2, p. 185–195, doi:10.1016/S1876-3804(15)30005-7.
Xiong, F., Z. Jiang, J. Chen, X. Wang, Z. Huang, G. Liu, F. Chen, Y. Li, L. Chen, and L. Zhang, 2016, The role of the residual bitumen in the gas storage capacity of mature lacustrine shale: A case study of the Triassic Yanchang shale, Ordos Basin, China: Marine and Petroleum Geology, v. 69, p. 205–215, doi:10.1016/j.marpetgeo.2015.10.022.
Yang, D., D. Elsworth, Z. Q. Kang, Y. S. Zhao, and B. S. Zheng, 2012, Experiments on permeability evolution with tempeatrure of oil shale: American Rock Mechanics Association 46th US Rock Mechanics/Geomechanics Symposium, Chicago, Illinois, June 24–27, 2012, ARMA-2012-386, 5 p.
Yang, Y., and A. C. Aplin, 1998, Influence of lithology and compaction on the pore size distribution and modeled permeability of some mudstones from the Norwegian margin: Marine and Petroleum Geology, v. 15, no. 2, p. 163–175, doi:10.1016/S0264-8172(98)00008-7.
Yang, Y., and G. Mavko, 2018, Mathematical modeling of microcrack growth in source rock during kerogen thermal maturation: AAPG Bulletin, v. 102, no. 12, p. 2519–2535, doi:10.1306/05111817062.
Zhang, H., Y. Jiang, K. Zhou, Y. Fu, Z. Zhong, X. Zhang, L. Qi, Z. Wang, and Z. Jiang, 2020, Connectivity of pores in shale reservoirs and its implications for the development of shale gas: A case study of the Lower Silurian Longmaxi Formation in the southern Sichuan Basin: Natural Gas Industry B, v. 7, no. 4, p. 348–357, doi:10.1016/j.ngib.2019.12.003.
Zhu, H., Y. Ju, Y. Qi, C. Huang, and L. Zhang, 2018, Impact of tectonism on pore type and pore structure evolution in organic-rich shale: Implications for gas storage and migration pathways in naturally deformed rocks: Fuel, v. 228, p. 272–289, doi:10.1016/j.fuel.2018.04.137.
AUTHORS
Syed Haider earned his Ph.D. from KAUST in 2021. He works on the multiscale physical and data-driven model of production from thousands of shale wells in the United States. His research interest is in the optimization of hydraulic fracturing, production forecasting, and sustainability analysis of renewable energy infrastructure. He earned his bachelor’s and master’s degrees from the Indian Institute of Technology, Kharagpur. During his free time, he enjoys discussing history, startups, and emerging technology.
Tadeusz (Tad) W. Patzek is the energy resources and petroleum engineering professor and the center director of the Ali I. Al-Naimi Petroleum Engineering Research Center at KAUST. Before coming to KAUST, he was the Lois K. and Richard D. Folger leadership professor and chairman of the Petroleum and Geosystems Engineering Department at The University of Texas at Austin. He also held the Cockrell Regents Chair #11. Between 1990 and 2008, he was a professor of geoengineering at the University of California, Berkeley. Before, he was a researcher at Shell Development. Patzek is a presidential full professor in Poland. His research involves mathematical and numerical modeling of earth systems with emphasis on subsurface fluid flow. He is working on the thermodynamics and ecology of human survival and energy supply for humanity. He is also working on unconventional natural gas and oil resources. Patzek is a coauthor of more than 400 papers and reports and one book. Recently, he received the highest technical honor bestowed by the European Association of Geoscientists and Engineers, the Desiderius Erasmus Award (for lifetime contribution). He has also received the 2021 Society of Petroleum Engineers IOR Pioneer Award. In 2022, he became a member of the standing committee on Threats to Civilization of the Polish Academy of Sciences and Arts.
Thomas Finkbeiner is a research professor at KAUST. He received his Ph.D. from Stanford University and joined King Abdullah KAUST in January of 2016, in the Ali Al Naimi Petroleum Engineering Research Center. The focus of his research is in rock and geomechanics, as well as rock physics for oil and gas, but also renewable energies (in particular carbon capture, utilization, and storage, and geothermal). Prior to joining KAUST, Thomas worked for 17 years in the petroleum industry, mostly in the field of geomechanics and related applications. Between 1998 and 2008, he worked for GeoMechanics International (GMI), where he managed and technically directed all of the company’s Europe, Africa, and Middle East operations. When Baker Hughes acquired GMI in 2008, he worked as the global geomechanics advisor. In 2011, he was appointed as Baker Hughes’ subject matter expert for geomechanics. From 2013 to 2015, Thomas worked for OMV in Vienna, Austria, as senior geomechanics expert and was responsible for fostering geomechanical understanding and applications in OMV exploration and production worldwide.
Ralf Littke is a geologist and professor at RWTH Aachen University, Aachen, Germany, holding the chair of Geology and Geochemistry of Petroleum and Coal since 1997. After earning his doctorate at Ruhr-Universität Bochum, he worked from 1985 to 1997 at the Federal Research Center, Jülich, Germany, in the Institute of Petroleum and Organic Geochemistry. His main research interests include the understanding of depositional and tectonic processes as well as thermal maturation, petroleum generation, and fluid flow in sedimentary basins. His laboratories are specialized in petroleum and environmental organic geochemistry, petrophysics of low-permeable rocks, organic petrology, and basin and petroleum system modeling.
ACKNOWLEDGMENTS
We are very grateful to Volker Vahrenkamp, Pierre Van Leer, and David Awwiller for the careful, exhaustive reviews of this paper and multiple valuable suggestions. Special thanks go to the previous AAPG editor, Robert K. Merrill, for shepherding the review process and many valuable recommendations. The AAPG Bulletin staff, Paula Sillman, Cory Godwin, and Andrea Sharrer, were of enormous help during the paper production. This work was supported by the Competitive Research Grant by KAUST, “Numerical and Experimental Investigation of Gas Distribution, Complex Hydrofractures and the Associated Flow in the Jafurah Basin Shales: Fundamentals to Applications,” with T. W. Patzek as principal investigator.
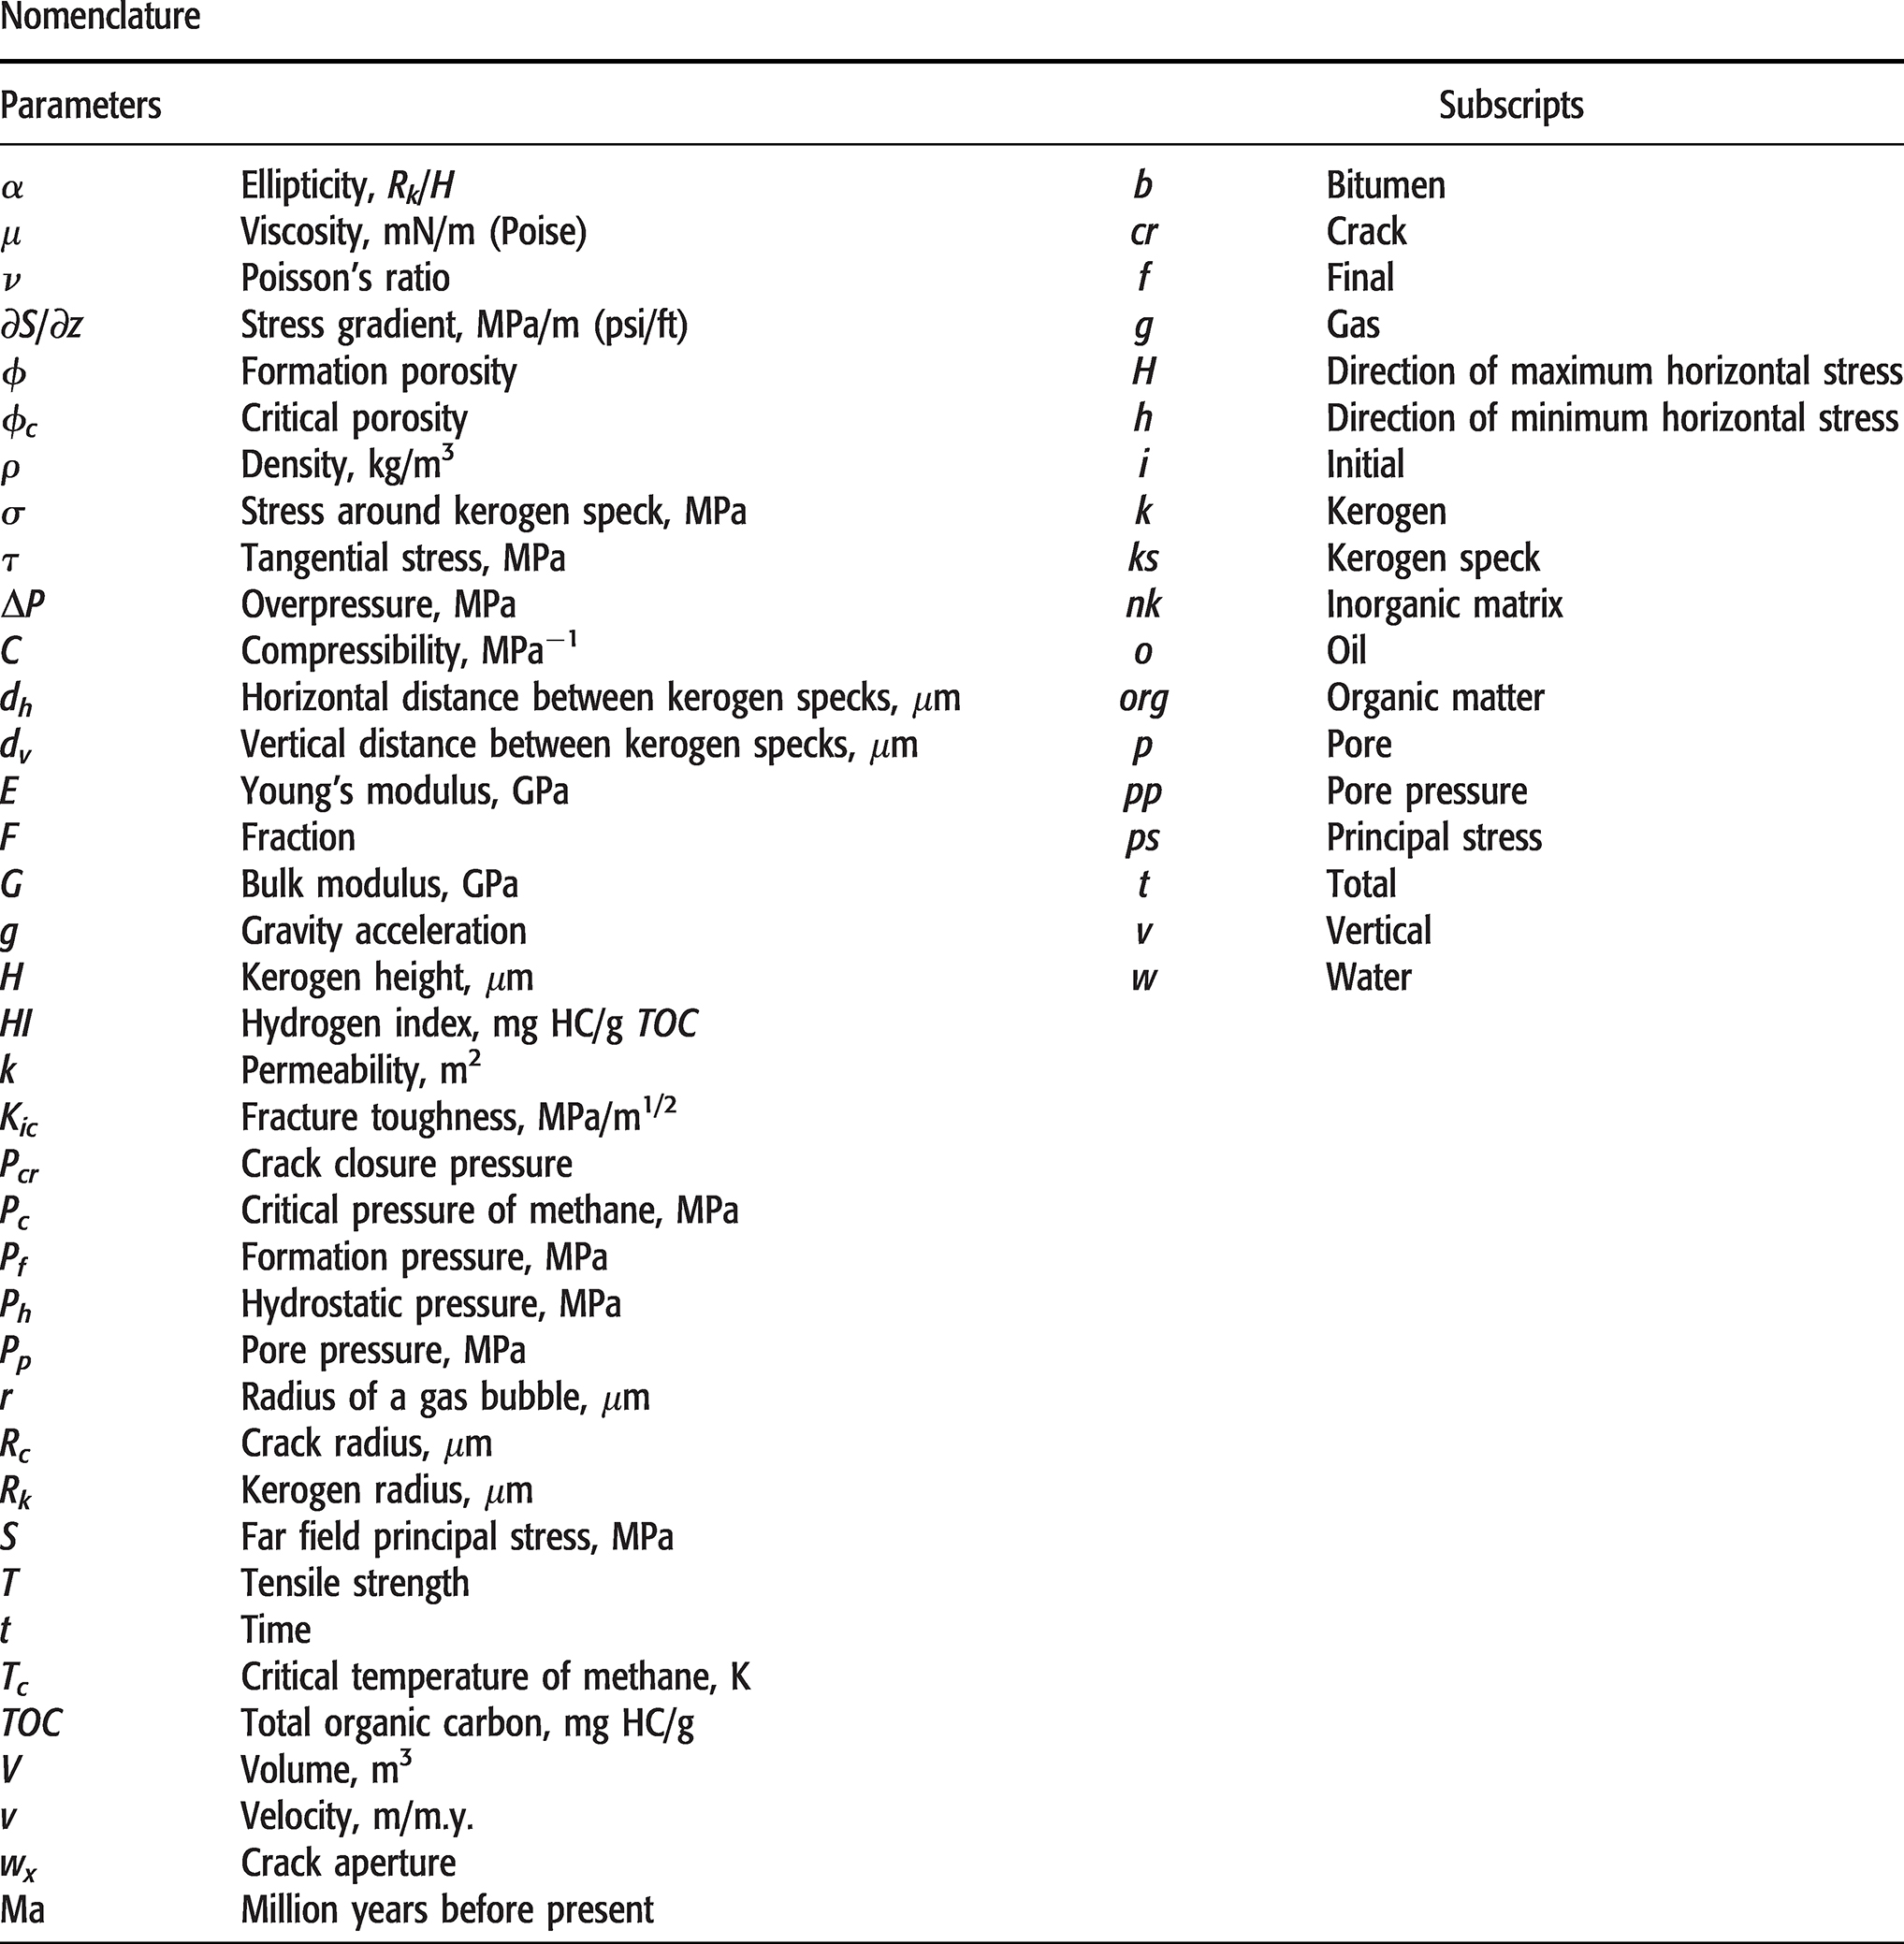
APPENDIX 1: OVERPRESSURE GENERATION IN A KEROGEN SPECK
Depending on the type of organic matter, thermal maturation produces oil and gas at different proportions. Guo et al. (2011, 2016) presented an analytical expression for overpressure generation because of oil and gas generation

where

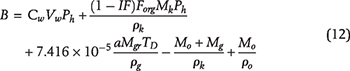
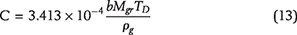
In equations 11–13, Mo, Mg, Mk, and Mgr are, respectively, the mass of oil, gas, kerogen, and the escaped gas; Vw is the water volume; Forg is the fraction of organic matter; TD is the temperature; Ph is the hydrostatic pressure; and Cw and Co are the water and gas compressibilities, respectively. The final equation for the overpressure P is
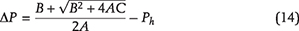
When overpressure inside a kerogen speck is sufficiently large to create and extend subcritical cracks, the extra crack volume created must be considered to correct this overpressure. With this extra volume, Vcr, the pore pressure, Pp, is decreased by adjusting the parameter B
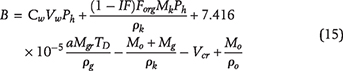
APPENDIX 2: WIDTH OF A SUBCRITICAL CRACK
The width, w(x), of a subcritical crack (twice the opening displacement) that originates from the initial kerogen speck depends on the stress intensity and the pore pressure inside the crack. Tsai (1969, 1982) and Nilson and Proffer (1984) proposed the following analytical expression:
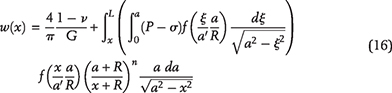
where G and ν are the shear modulus and Poisson’s ratio, respectively, and n = 0 or 1 for planar or axisymmetric cases, respectively. The f is the weighting function, which depends on a specific geometry and particular choice of L/R. The long fracture limit of the proposed formula is given by
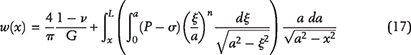
where n is 0 or 1 for planar and axisymmetric cases, respectively. To remove singularities, the differentials in the equation are rewritten as
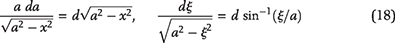
The volume of the subcritical crack is obtained from integrating the crack width over the length of the crack
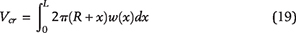
APPENDIX 3: CRACK INITIATION THEORY
The stress around an elliptical hole in response to the principal stresses σv and σh is given by
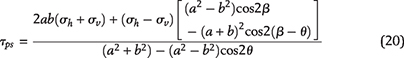
where β is the angle between the direction of minimum horizontal principal stress, σh, and the horizontal plane, θ, is the angle from the horizontal plane in the counterclockwise direction, and a and b are the major and minor axes of the elliptical crack, respectively.
If the elliptical crack is internally pressured by a fluid, the tangential stress at its surface is
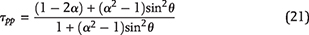
where α is the aspect ratio (a/b). Combining equations 20 and 21 gives the tensile stress acting along the surface of the elliptical microcrack. The crack initiates if the stress around it exceeds the tensile strength of the rock.
Crack closure depends on the stress state of the system and the magnitude of pore pressure. The crack can be fully closed under a sufficiently large differential pressure. The pressure at which the elliptical crack fully closes is given by
where Cp is the pore compressibility. The closing pressure of a 3-D penny-shaped crack of the aspect ratio, α, is

where ν is the Poisson’s ratio, and Cmatrix is the marix compressibility.
APPENDIX 4: RATE OF MICROCRACK GROWTH
Once a crack is created by reaching the required ΔPh, it propagates at the speed defined by Charles (Charles, 1958; Wiederhorn, 1978; Atkinson, 1982)

where vcr is the subcritical crack propagation velocity, A and n are the material constants, and KI is the stress intensity factor. The stress intensity factor is related to the overpressure and the initial radius of the kerogen, Rk, by the relation
As the crack propagates, its growing volume is Vcr. The decrease in the overpressure is calculated, considering the volume increase by the microcrack growth. The overpressure ΔP decreases, and finally, ΔP is insufficient to drive the crack further. Once this point is reached, the rate of oil and gas generation controls crack growth with time. The minimum value of ΔP required to keep the crack growing depends on the threshold fracture toughness, KIth, and the crack radius:
APPENDIX 5: SENSITIVITY ANALYSIS: FORMATION DEPTH
In this paper, the present-day pore pressure for the Tuwaiq Mountain Formation was modeled at its present depth of 3.5 km. The range of overpressure estimated at this depth would reflect a lower bound of the overpressure that can be retained in the formation. When maturation started at 110 Ma, the formation depth was 2.7 km (i.e., 700 m shallower compared with its present depth). The formation depth has a significant effect on the stress ratios and the pore pressure and hence, on the dynamics of crack formation, the extent of primary hydrocarbon migration, and the present-day overpressure. To consider sensitivity in response to the formation depth, we calculated the timing and extent of primary hydrocarbon migration and the present-day overpressure at the depth of 2.7 km. This calculation gives an upper bound of overpressure that can be retained in the formation. Thus, in a dynamic system where the formation depth gradually increased from 2.5 km to 3.5 km, the overpressure would lie between the upper bound range modeled at 2.7 km and the lower bound range modeled at 3.5 km. Table 2 compares the timing of different processes and the estimated present overpressure values for the depths of 3.5 km and 2.7 km.
APPENDIX 6: IMPORTANCE OF THERMAL MATURATION RATE
Laboratory pyrolysis experiments are widely used to quantify the extent of primary hydrocarbon migration (Leythaeuser et al., 1984; Lewan and Ruble, 2002; Gorynski et al., 2019; Grohmann et al., 2023). For the same source rock sample, experiments at different rates of thermal maturation of kerogen give different estimates of primary oil migration. A higher maturation rate leads to more oil expelled from the source rock because the oil-saturated pore space that supports fluid flow remains connected most of the time. Conversely, slow hydrocarbon maturation leads to less primary hydrocarbon expulsion because the oil-saturated pore space remains connected only for a limited time. To quantify this effect, we assume 30% as the oil saturation below which the macroscopic oil flow stops. Based on this assumption, Figure 19 shows a synthetic example of two different rates of generation of the same amount of hydrocarbons, represented by the red curves (+, ○). The corresponding black symbols (+, ○) show the amount of remaining hydrocarbon in the source rock, once the oil saturation in the source rock drops down to
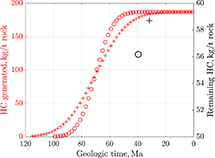 Figure 19. The effect of the thermal maturation rate on the amount of hydrocarbon (HC) expelled from the source rock at the minimum irreducible saturation of oil equal to 30%. For a wide range of thermal maturity, the total amount of expelled HC varies little.
However, the basin evolution during secondary cracking of the remaining oil to gas is very sensitive with respect to time. This is because the evolution of overpressure in the gas generation window is a sensitive function of time (see Figure 17B). So, to quantify hydrocarbon expulsion and overpressure evolution more accurately, pyrolysis laboratory experiments must correlate well with the geological maturation rate and the geologic time.
APPENDIX 7: SENSITIVITY ANALYSIS: EFFECT OF ROCK YOUNG’S MODULUS AND TENSILE STRENGTH
The parameters used in our simulations (e.g., the porosity, TOC content, pyrolysis kinetics, and conversion extent data) have small uncertainties relative to the rock mechanical parameters, such as Young’s modulus, E, and the tensile strength, T, of the rock. Another important parameter with a wide uncertainty range is the stress ratio (σh/σv) in the past. Its strong effect on the possibility of primary hydrocarbon migration was highlighted in the paper. Here, we present how Young’s modulus and tensile strength of the rock affect crack coalescence and primary hydrocarbon migration.
Figure 20A shows the effect of Young’s modulus on crack coalescence time. For a wide range of ellipticity, α, a higher Young’s modulus accelerates crack coalescence. For E = 10 GPa, all kerogen specks in an organic-rich layer of the formation connected at 67 Ma. For E = 2 GPa, the same kerogen specks connected between 65 and 55 Ma. In the range of speck flatness, α ∈ [10, 25], the maximum delay of crack coalescence is 5 m.y. This delay does not impact the efficiency of hydrocarbon expulsion from the source rock, but it has a significant effect on the development of overpressure during the gas generation stage, previously explained in Figure 17B.
 Figure 20. (A) For the speck ellipticities between 10 and 30, the time to create a connected fracture network decreases with the increasing Young’s modulus (E). The maximum time difference in the Tuwaiq Mountain Formation is 5 Ma. This time difference has noticeably affected evolution of the pore overpressure until today. (B) A wide range of tensile strengths (T ) of kerogen specks has a negligible effect on crack initiation time.
For a given value of tensile strength, the time at which cracks start forming is a strong function of the ellipticity of the kerogen specks. This formation time increases sharply as speck ellipticity decreases below 10. If we consider the highly flattened kerogen specks in an organic-rich layer of the source roc (see Figure 20B), the tensile strength of the rock does not have a significant effect on the time when the crack starts forming, thus having a small effect on the evolution of the basin in subsequent stages of primary hydrocarbon migration.