The AAPG/Datapages Combined Publications Database
AAPG Bulletin
Full Text
![]() Click to view page images in PDF format.
Click to view page images in PDF format.
AAPG Bulletin, V.
DOI: 10.1306/12202222033
Permeability of upper Wolfcamp lithofacies in the Delaware Basin: The role of stratigraphic heterogeneity in the production of unconventional reservoirs
Sebastian Ramiro-Ramirez,1 Athma R. Bhandari,2 Robert M. Reed,3 and Peter B. Flemings4
1Institute for Geophysics and Department of Earth and Planetary Sciences, Jackson School of Geosciences, The University of Texas at Austin, Austin, Texas; [email protected]
2Institute for Geophysics, Jackson School of Geosciences, The University of Texas at Austin, Austin, Texas; [email protected]
3Bureau of Economic Geology, Jackson School of Geosciences, The University of Texas at Austin, Austin, Texas; [email protected]
4Institute for Geophysics and Department of Earth and Planetary Sciences, Jackson School of Geosciences, The University of Texas at Austin, Austin, Texas; [email protected]
ABSTRACT
The drainage of low-permeability unconventional reservoirs is often interpreted to be controlled by hydraulic and natural fractures that drain a homogenous low-permeability mudstone. However, stratigraphic heterogeneity, which results in strong variations in permeability, may also play an important role. We demonstrate that thin dolomitized carbonate sediment gravity flow deposits are over 25 times more permeable on average than the volumetrically dominant mudstone that is the source of most of the oil in the upper Wolfcamp interval of the Delaware Basin. We conducted steady-state liquid (dodecane) permeability measurements in 30 horizontal core plugs from six upper Wolfcamp lithofacies. The dolomitized calcareous lithofacies have effective permeabilities to dodecane of up to 2000 nd, whereas the remaining mudstones, dolomudstones, and calcite-bearing lithofacies have permeabilities of less than 60 nd. We constructed a layered flow model to examine the role of high-permeability layers in drainage at the completion scale. Flow is focused through the permeable layer, resulting in upscaled permeabilities and production rates that are up to four times greater than a reservoir composed of only low-permeability strata. Our analysis shows the importance of understanding stratigraphy, permeability, and flow behavior at the thin-bed scale. This understanding can illuminate what landing zones will be economical, the optimal spacing of hydraulic fractures, and whether there will be significant interference between multiple wells during production. The flow focusing that we infer from the Wolfcamp is most likely a universal characteristic of unconventional reservoirs.
INTRODUCTION
The Wolfcamp operational unit in the Permian Basin region of western Texas and southeastern New Mexico is the most prolific low-permeability, liquid-hydrocarbon (i.e., crude oil and condensates) onshore producing interval in the United States (Energy Information Administration, 2022). In 2021, the average daily production in the Wolfcamp ranged between 1.8 and 2.4 million bbl, surpassing both the Eagle Ford (Texas) and the Bakken (North Dakota and Montana) Formations (Energy Information Administration, 2022). Hydrocarbons are produced at such economic rates from these low-permeability formations by combining horizontal drilling with multistage hydraulic fracturing techniques (Yu and Sepehrnoori, 2018; Zoback and Kohli, 2019). The long lateral lengths of horizontal wells and the artificial fracture network created in the rock increase the surface area of the reservoir exposed to the wellbore, resulting in economically viable production rates. In addition to operational factors, the stratigraphic architecture and consequent distribution of geological and petrophysical rock properties play a significant role in primary production from low-permeability reservoirs (Sagasti et al., 2014; Wilson et al., 2020; Euzen et al., 2021; Fraser and Pedersen, 2021).
The matrix permeability describes the flow behavior through the interconnected pores of the rock. Low-permeability reservoirs, which are often dominated by fine-grained, organic-rich lithofacies (e.g., mudstones), have matrix permeabilities ranging from 1 to 30 nd (Vermylen, 2011; Bhandari et al., 2018, 2019). However, bulk permeabilities greater than those measured in core plugs from these lithofacies are often assumed to successfully simulate production in reservoir models. For example, Patzek et al. (2013) found that an upscaled permeability of 500 nd in early production and 50 nd in late production times were required in Barnett Shale reservoirs, even though estimates of the rock permeability were ∼3 nd.
It has been suggested that the stimulation process alone (i.e., hydraulic fracturing) may increase the upscaled permeability of the reservoir by, for instance, reopening preexisting natural fractures in the reservoir (Gale et al., 2007; Patzek et al., 2013) or creating a complex secondary hydraulic fracture network (Mohan et al., 2013). However, a recent study suggested that only a small fraction of natural fractures (i.e., less than 10%) reactivate during stimulation (Male et al., 2021), and for what minor fracture reactivation there is, it may not be enough to transfer fluids to the wellbore at significant rates (Salem et al., 2022). Also, cores obtained from stimulated reservoir intervals in the Wolfcamp (Gale et al., 2018, 2021) and Eagle Ford Formation (Raterman et al., 2018) do not exhibit the development of complex secondary fractures. Hence, the upscaled permeabilities in these reservoirs may increase due to geological factors not previously considered.
An opposite interpretation is that stratigraphic layering of multiple lithofacies with different fabric and pore systems results in a heterogeneous permeability system. During production, the more permeable lithofacies may drain fluids from the less permeable strata (Katz and Tek, 1962; Pendergrass and Berry, 1962; Russell and Prats, 1962; Park, 1989; Phillips, 1991; Kuhl, 2003). This drainage behavior can increase the upscaled permeability of the hydraulically fractured intervals. Such behavior is possible in low-permeability formations because they often contain multiple lithofacies with matrix permeabilities that vary by orders of magnitude (e.g., Kurtoglu, 2013; Kosanke and Warren, 2016; Ramiro-Ramirez et al., 2021). In the Wolfcamp, previous core-based studies indicate the presence of drastic permeability heterogeneity (i.e., 10–600 nd) (Rafatian and Capsan, 2015; Mathur et al., 2016; King et al., 2018; Bhandari et al., 2019). However, these studies provide a limited geological context for the tested samples. Hence, the reported permeabilities cannot be related to the stratigraphy of the Wolfcamp to study their effect on the upscaled permeabilities.
In this study, we measured the porosity and permeability of all of the lithofacies (see Ramiro-Ramirez, 2022) in the Wolfcamp A and Wolfcamp B units of the Delaware Basin. We show that the major oil reservoir is the volumetrically dominant organic-rich ![]() siliceous
siliceous![]() mudstone lithofacies, which has a permeability on the order of 20 nd. We also demonstrate that dolomitized carbonate turbidites, which are volumetrically a small fraction of the reservoir, have permeabilities up to 2000 nd. We present a flow model to illustrate how the high-permeability dolomitic turbidites accelerate the drainage of the organic-rich
mudstone lithofacies, which has a permeability on the order of 20 nd. We also demonstrate that dolomitized carbonate turbidites, which are volumetrically a small fraction of the reservoir, have permeabilities up to 2000 nd. We present a flow model to illustrate how the high-permeability dolomitic turbidites accelerate the drainage of the organic-rich ![]() siliceous
siliceous![]() mudstone, resulting in a much higher upscaled permeability than would be required if these high-permeability layers were not considered. Our work illustrates why there has been more success in the Wolfcamp A, where high-permeability layers are more abundant, than in the Wolfcamp B. Nonetheless, there are intervals within the Wolfcamp B that may be significant economic targets. More broadly, our work emphasizes the critical importance of understanding stratigraphic heterogeneity and associated differences in permeability at the decimeter scale to predict reservoir performance and design completion programs in unconventional reservoirs.
mudstone, resulting in a much higher upscaled permeability than would be required if these high-permeability layers were not considered. Our work illustrates why there has been more success in the Wolfcamp A, where high-permeability layers are more abundant, than in the Wolfcamp B. Nonetheless, there are intervals within the Wolfcamp B that may be significant economic targets. More broadly, our work emphasizes the critical importance of understanding stratigraphic heterogeneity and associated differences in permeability at the decimeter scale to predict reservoir performance and design completion programs in unconventional reservoirs.
We begin by describing the porosity and permeability in core plugs extracted from upper Wolfcamp lithofacies. Then, we interpret the lithofacies control on permeability based on petrographic and petrophysical analyses of the pore system in the tested samples. Lastly, we perform flow simulations in a layered reservoir model and discuss the impact of the permeability heterogeneity on the upscaled permeabilities in the upper Wolfcamp interval.
GEOLOGIC OVERVIEW
In our study area (Figure 1), Ramiro-Ramirez (2022) defined six lithofacies in the upper Wolfcamp interval and interpreted their depositional environment (Table 1). He studied the Wolfcamp B (upper Wolfcampian) and the overlying Wolfcamp A (lower Leonardian) units (Figure 2). We summarize those results below.
 Figure 1. Modern topography in western Texas and southeastern New Mexico, with key components of the Permian Basin region during the early Permian (late Wolfcampian to early Leonardian) overlain. The green circle indicates the location of studied core in the centraleastern Delaware Basin. Figure derived from Hunt and Fitchen (1999), Dutton et al. (2005), and Fu et al. (2020). Mts. = Mountains.

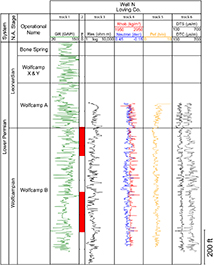 Figure 2. Wire-line log curves of well N and cored intervals (indicated by red bars) studied here. Ramiro-Ramirez (2022) describes the Wolfcamp operational units. Track 1: gamma ray (GR). Track 2: cored interval (red). Track 3: deep resistivity (Res). Track 4: bulk density (Rhob) (red) and neutron porosity (blue). Track 5: photoelectric effect (Pef). Track 6: shear slowness (DTS) (dashed line) and compressional slowness (DTC) (solid line). Co. = County; N.A. = North America.
The lower part of the Wolfcamp B unit (Figure 3) is dominated by organic-rich ![]() siliceous
siliceous![]() mudstone (lithofacies 1, Table 1). This mudstone is interpreted to record hemipelagic deposition. It is interbedded with laterally continuous calcareous mudstone (lithofacies 3a, Table 1) and calcareous sandstone (lithofacies 4a, Table 1), which are interpreted to record deposition from carbonate turbidites. When dolomitic, these two lithofacies are subclassified into dolomitic calcareous mudstone (lithofacies 3b, Table 1) and dolomitic calcareous sandstone (lithofacies 4b, Table 1), and they are interpreted as dolomitized carbonate turbidites. Matrix-supported conglomerates (lithofacies 5, Table 1) are interpreted as cohesive debrites; they are rare and form very thin deposits in this interval.
mudstone (lithofacies 1, Table 1). This mudstone is interpreted to record hemipelagic deposition. It is interbedded with laterally continuous calcareous mudstone (lithofacies 3a, Table 1) and calcareous sandstone (lithofacies 4a, Table 1), which are interpreted to record deposition from carbonate turbidites. When dolomitic, these two lithofacies are subclassified into dolomitic calcareous mudstone (lithofacies 3b, Table 1) and dolomitic calcareous sandstone (lithofacies 4b, Table 1), and they are interpreted as dolomitized carbonate turbidites. Matrix-supported conglomerates (lithofacies 5, Table 1) are interpreted as cohesive debrites; they are rare and form very thin deposits in this interval.
 Figure 3. Characteristic stratigraphic architecture of the lower (bottom) and middle-to-upper (center) sections of the Wolfcamp B unit and Wolfcamp A unit (top). HEB = hybrid event bed.
In the middle-to-upper parts of the Wolfcamp B unit (Figure 3), the organic-rich ![]() siliceous
siliceous![]() mudstone is interbedded with laterally continuous argillaceous mudstone (lithofacies 2, Table 1), which is interpreted to record siliciclastic turbidites. This mudstone has higher clay content, has lower total organic carbon (TOC), and is finer grained than the organic-rich
mudstone is interbedded with laterally continuous argillaceous mudstone (lithofacies 2, Table 1), which is interpreted to record siliciclastic turbidites. This mudstone has higher clay content, has lower total organic carbon (TOC), and is finer grained than the organic-rich ![]() siliceous
siliceous![]() mudstone. Dolomudstone (lithofacies 6, Table 1) is always associated with the argillaceous mudstone and is interpreted to have formed by early diagenetic dolomite precipitation. The calcareous mudstone and calcareous sandstone lithofacies occur only occasionally in this interval, and they are usually dolomitized. The matrix-supported conglomerate is found toward the uppermost part of the unit, forming thick, laterally discontinuous deposits alternating with the organic-rich
mudstone. Dolomudstone (lithofacies 6, Table 1) is always associated with the argillaceous mudstone and is interpreted to have formed by early diagenetic dolomite precipitation. The calcareous mudstone and calcareous sandstone lithofacies occur only occasionally in this interval, and they are usually dolomitized. The matrix-supported conglomerate is found toward the uppermost part of the unit, forming thick, laterally discontinuous deposits alternating with the organic-rich ![]() siliceous
siliceous![]() mudstone.
mudstone.
The overlying Wolfcamp A unit is quite different from the Wolfcamp B unit. The organic-rich ![]() siliceous
siliceous![]() mudstone alternates with frequent calcareous mudstone and calcareous sandstone lithofacies (Figure 3), interpreted as carbonate hybrid event beds. In addition, the calcareous mudstone and calcareous sandstone lithofacies are often dolomitized in this unit.
mudstone alternates with frequent calcareous mudstone and calcareous sandstone lithofacies (Figure 3), interpreted as carbonate hybrid event beds. In addition, the calcareous mudstone and calcareous sandstone lithofacies are often dolomitized in this unit.
MATERIALS AND METHODS
Samples
We extracted core plugs from a vertical core that spans 403 ft of the Wolfcamp B unit in the Delaware Basin (Figures 1, 2). The core was slabbed and photographed, immediately preserved in aluminum foil followed by plastic film, and sealed in wax.
To choose sampling locations, we first defined the lithofacies in the core at the inch scale (see Ramiro-Ramirez, 2022) and then selected the best core depths to extract high-quality, unfractured specimens. We recovered 90 core plugs with a diameter of either 1.5 in. (3.81 cm) or 1.0 in. (2.54 cm), and with their long axis oriented either parallel or normal to the bedding plane. The plugs were cored using humidified nitrogen as a coolant to avoid fluid interaction with the rock components (e.g., water with expansive clays). We preserved the core plugs in plastic film and aluminum foil and stored them in plastic containers.
The quality of the extracted core plugs varied. We selected core plugs for permeability measurements from each lithofacies that had no open fractures visible to the naked eye. We acquired high-resolution x-ray microcomputed tomography (micro-CT) images of these core plugs to assess the presence of natural fractures and artificial microfractures (e.g., coring induced).
We measured the total porosity in 40 core plugs by combining helium porosimetry and nuclear magnetic resonance (NMR) techniques. We measured the liquid permeability to dodecane in 30 of the core plugs at varying effective stress conditions using the steady-state technique. Tables A1 and A2 (supplementary material available as AAPG Datashare 178 at
Porosity
We measured the total porosity in our core plugs at as-received conditions. Thus, we did not perform any core cleaning or oven drying. We obtained the total porosity (φt) by summing the helium porosity (φHe) and the NMR porosity (φNMR) (e.g., Rydzy et al., 2016; Romero-Sarmiento et al., 2017):

The helium porosity (φHe) is the pore volume accessible by helium gas divided by the bulk volume of the sample. The NMR porosity (φNMR) is the pore volume occupied by the structural and remnant in situ liquids (formation water, clay-bound water, and liquid hydrocarbons) divided by the bulk volume of the sample. The experimental procedures and equipment used to measure the porosity are documented in Ramiro-Ramirez (2022).
Permeability
Experimental Setup
We performed our permeability measurements in four identical permeability test cells equipped with a dual-cylinder Quizix Q5000 pump and a dual-cylinder Quizix QX-10K pump to control, respectively, the upstream and downstream pore fluid pressures in the core plug. A second dual-cylinder Quizix QX-10K controls the axial and radial confining pressures applied on the core plug. The pore fluid pressures are measured with pressure transducers installed at both ends of the core holder. The schematic of our apparatus was given previously by Bhandari et al. (2019).
The temperature inside the cell was actively controlled to remain constant at 30.0°C ± 0.1°C (maximum fluctuation) during the permeability experiments. We conducted our permeability experiments using dodecane, C12H26 (CAS 112-40-3), which is a liquid alkane hydrocarbon that is miscible with crude oil, but it is immiscible with water.
Test Program
Our test program consists of two saturation stages followed by six steady-state liquid permeability tests at varying confining pressure (Pc) conditions (2000–9500 psi) (13.79–65.50 MPa) while maintaining the pore pressure (Pp) at approximately 1000 psi (6.89 MPa) (Figure 4). The radial and axial confining pressures were applied equally on the core plug; therefore, we tested the samples at isostatic confining stress conditions. We assume the Pp to be the average of the upstream and downstream pore fluid pressures in the core plug.
 Figure 4. Permeability test program consisting of a sample saturation stage followed by two loading-unloading confining pressure (Pc) cycles. The steady-state permeability tests are conducted at isostatic (vertical = horizontal) confining stress conditions. The effective stress is the Pc minus the pore pressure (Pp). The average total time to complete the test program is ∼30 days per sample.
We conducted the first saturation stage by drawing a vacuum on the sample and then flooding the sample with dodecane. These conditions were held at atmospheric pressure for 24 hr (Figure 4). The second saturation stage lasted 5–7 days and consisted of raising the Pc to 1000 psi (6.89 MPa) and the Pp to 750 psi (5.17 MPa), as described by Bhandari et al. (2019).
We then performed six permeability tests at different confining pressures while holding the Pp at approximately 1000 psi (∼6.89 MPa). Between tests, we changed Pc at a constant rate of 25 psi/min (0.17 MPa/min) while setting Pp constant at 950 psi (6.55 MPa) on the upstream and downstream sides of the core plug. In addition, we let the sample stabilize at the new Pc for 24 hr before conducting the permeability test. We increased the Pc to 6500 psi (44.81 MPa), decreased it to 5500 psi (37.92 MPa), and then conducted the first steady-state permeability test (test 1; Figure 4). We then decreased the Pc to 2000 psi (13.79 MPa) and conducted test 2. We conducted the ensuing permeability tests at confining pressures of 5500 psi (37.92 MPa) (test 3), 9500 psi (65.50 MPa) (test 4), 5500 psi (37.92 MPa) (test 5), and 2000 psi (13.79 MPa) (test 6) (Figure 4).
Steady-State Liquid (Dodecane) Permeability
The samples are from an oil-producing reservoir and were provided at an as-received condition. Our goal was to measure the effective permeability to the oil phase at approximately the in situ saturations. We therefore used dodecane as the test fluid, which is miscible with any remnant liquid hydrocarbon in the rock. We used the steady-state method because it is straightforward to interpret the measurements. We did not use the pulse decay method (Brace et al., 1968; Bhandari et al., 2019) because it requires the fluid compressibility to be much higher than the rock compressibility for a straightforward interpretation (Brace et al., 1968). This is not possible when a liquid is used for the pore fluid because both the compressibility of the bulk rock and the fluid can be similar.
We conducted liquid steady-state permeability tests at each confining stress indicated in Figure 4 (tests 1–6) following the experimental procedures documented in Ramiro-Ramirez (2022). We injected dodecane at a constant flow rate at the upstream side of the core plug while maintaining the pressure constant in the downstream side to generate a pressure differential typically of 100 psi (0.69 MPa) across the sample. We continued the test until the pressure differential was approximately constant over time (i.e., there is steady flow across the sample); this typically takes more than 12 hr. We then calculated the permeability of the core plug using Darcy’s law (equation 2):
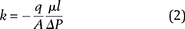
where k is the permeability (darcys), q is the flow rate (cm3/s), μ is the viscosity (cp) of dodecane at the pore pressure of 1000 psi and temperature of 30°C, ΔP is the pressure differential (atm) between the upstream and downstream sides of the core plug, and A and l are the cross-sectional area (cm2) and the length (cm) of the core plug, respectively. Since we tested our samples at as-received conditions, the calculated k corresponds to the effective permeability to dodecane (i.e., the effective permeability to the oil phase).
Petrographic Characterization
We characterized the texture and pore types of the samples with field emission-scanning electron microscopy (SEM). An ∼5-mm-side cube of rock was subsampled from each core plug. The subsampled cubes were argon ion beam milled to prepare a flat surface (∼1.5 × ∼0.5 mm in size) for imaging; this sample preparation technique eased the identification of real pores versus artifacts (Loucks et al., 2009).
Backscattered electron-SEM images (Camp and Wawak, 2013) and energy-dispersive x-ray spectrometry (Huang et al., 2003; Curtis et al., 2010) maps were acquired. We used these images to interpret the mineral phases (e.g., dolomite and quartz), document the organic matter distribution, and characterize the pore types. We use organic matter as a generic term to classify any organic compound identified petrographically. We did not distinguish between organic matter types (e.g., kerogen or macerals, bitumen, solid bitumen, oil, and pyrobitumen) (Jarvie et al., 2007; Bernard et al., 2012a; Milliken et al., 2014) because this is not always possible with SEM petrography alone (Mastalerz et al., 2018).
EXPERIMENTAL RESULTS
Total Porosity
The organic-rich ![]() siliceous
siliceous![]() mudstone and the argillaceous mudstone lithofacies together have a median total porosity of 12.4%, whereas the carbonate lithofacies taken together have a median total porosity of 3.5% (Figure 5). We estimate the fraction of the pore volume that lies within the mudstones (Vms) with equation 3:
mudstone and the argillaceous mudstone lithofacies together have a median total porosity of 12.4%, whereas the carbonate lithofacies taken together have a median total porosity of 3.5% (Figure 5). We estimate the fraction of the pore volume that lies within the mudstones (Vms) with equation 3:
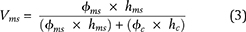
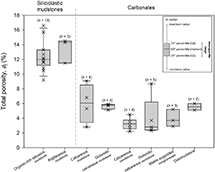 Figure 5. Total porosity
  of all of the samples measured by lithofacies. The median φt of the siliciclastic mudstones (i.e., organic-rich
 ![]() siliceous
siliceous![]() mudstone and argillaceous mudstone) is φms = 12.4%, whereas that of the carbonates is φc = 3.5%. For each lithofacies, the top and bottom lines represent the maximum and minimum values, respectively. The top and bottom edges of the gray box mark the first and third percentiles, respectively. The median value is the horizontal line within the box. Values that fall beyond the lower limit (25th percentile − 1.5 × interquartile range) and the upper limit (75th percentile + 1.5 × interquartile range) represent outliers. The is the sum of both the helium-derived porosity
mudstone and argillaceous mudstone) is φms = 12.4%, whereas that of the carbonates is φc = 3.5%. For each lithofacies, the top and bottom lines represent the maximum and minimum values, respectively. The top and bottom edges of the gray box mark the first and third percentiles, respectively. The median value is the horizontal line within the box. Values that fall beyond the lower limit (25th percentile − 1.5 × interquartile range) and the upper limit (75th percentile + 1.5 × interquartile range) represent outliers. The is the sum of both the helium-derived porosity  and the nuclear magnetic resonance–derived porosity
  (see also Table A1, supplementary material available as AAPG Datashare 178 at
where hms and hc are the relative thickness of the mudstones and carbonates, respectively, and φms and φc are the median total porosity of the mudstones and carbonates, respectively. The siliciclastic mudstones (Figure 6A) comprise 82% of the total thickness of all of the cores studied in the Wolfcamp A and Wolfcamp B (Ramiro-Ramirez, 2022); thus, hms = 0.82 and hc = 0.18. The median total porosities are 12.4% and 3.5% for the mudstone and carbonates as stated above. We find that 94% of the total pore volume is in siliciclastic mudstones (Figure 6B), with the remaining 6% present in the carbonates.
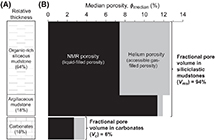 Figure 6. (A) Relative thickness of siliciclastic mudstones (i.e., organic-rich
 ![]() siliceous
siliceous![]() mudstone and argillaceous mudstone) and carbonates in the studied Wolfcamp interval. (B) Median nuclear magnetic resonance (NMR) porosity (black area) and helium porosity (gray area) in tested samples from siliciclastic mudstones (n = 17 samples) and carbonates (n = 23 samples) lithofacies. The thickness of the bars is proportional to the relative thickness of each lithofacies according to (A).
mudstone and argillaceous mudstone) and carbonates in the studied Wolfcamp interval. (B) Median nuclear magnetic resonance (NMR) porosity (black area) and helium porosity (gray area) in tested samples from siliciclastic mudstones (n = 17 samples) and carbonates (n = 23 samples) lithofacies. The thickness of the bars is proportional to the relative thickness of each lithofacies according to (A).
The fractional NMR porosity (i.e., the fraction of the liquid-filled porosity relative to the total porosity) is 90% in the argillaceous mudstone lithofacies (Figure 6B). This indicates that 90% of the pore fluid is liquid in these samples. This lithofacies also has low electrical resistivity in wire-line logs (Ramiro-Ramirez, 2022), and we interpret from this that it has a very high water saturation. Thompson et al. (2018) also found high water saturations in similar clay-rich lithofacies in the Wolfcamp B. We interpret that the liquid loss is small because the pore fluid is mostly water (thus less evaporation), because there is little effective porosity (the water is immobile), and because a large fraction of the pore water is clay bound. The fractional NMR porosity in the organic-rich ![]() siliceous
siliceous![]() mudstone lithofacies is 60% (Figure 6B). Its resistivity is much higher than that of the argillaceous mudstone (Ramiro-Ramirez, 2022). We interpret that this lithofacies is saturated with both liquid hydrocarbons and water. Thompson et al. (2018) and Zhang et al. (2021) indicate that organic-rich
mudstone lithofacies is 60% (Figure 6B). Its resistivity is much higher than that of the argillaceous mudstone (Ramiro-Ramirez, 2022). We interpret that this lithofacies is saturated with both liquid hydrocarbons and water. Thompson et al. (2018) and Zhang et al. (2021) indicate that organic-rich ![]() siliceous
siliceous![]() mudstones in the Wolfcamp A and Wolfcamp B units have significant oil saturations.
mudstones in the Wolfcamp A and Wolfcamp B units have significant oil saturations.
The fractional NMR porosity is 70% in the carbonate lithofacies (Figure 6B), indicating that they also have a high liquid saturation. The resistivities in carbonate lithofacies (except the dolomudstone) are in general similar to or higher than those in the organic-rich ![]() siliceous
siliceous![]() mudstone lithofacies (Ramiro-Ramirez, 2022). This high resistivity is partly due to their low porosity and low clay content. However, this high resistivity may also indicate that carbonate lithofacies have a significant fraction of their pore volume saturated with liquid hydrocarbons. Thompson et al. (2018) found that carbonate lithofacies have low water saturations in the Wolfcamp A and Wolfcamp B, and Zhang et al. (2021) showed that the carbonate lithofacies of the Wolfcamp A may act as reservoirs for the oil expelled by the adjacent organic-rich
mudstone lithofacies (Ramiro-Ramirez, 2022). This high resistivity is partly due to their low porosity and low clay content. However, this high resistivity may also indicate that carbonate lithofacies have a significant fraction of their pore volume saturated with liquid hydrocarbons. Thompson et al. (2018) found that carbonate lithofacies have low water saturations in the Wolfcamp A and Wolfcamp B, and Zhang et al. (2021) showed that the carbonate lithofacies of the Wolfcamp A may act as reservoirs for the oil expelled by the adjacent organic-rich ![]() siliceous
siliceous![]() mudstones.
mudstones.
Permeability
We discuss our effective permeability measurements to dodecane (oil phase) in detail with one experiment on the organic-rich ![]() siliceous
siliceous![]() mudstone and one experiment on the dolomitic calcareous sandstone. We then review how to interpret the matrix permeability from these experiments. Finally, we estimate the in situ permeability for all of our tested samples and thereby describe the permeability of individual lithofacies.
mudstone and one experiment on the dolomitic calcareous sandstone. We then review how to interpret the matrix permeability from these experiments. Finally, we estimate the in situ permeability for all of our tested samples and thereby describe the permeability of individual lithofacies.
Permeability-Stress Behavior and Its Interpretation
The initial permeability of the organic-rich ![]() siliceous
siliceous![]() mudstone sample is 148 nd (test 1) at an effective stress (i.e., Pc – Pp) of 4500 psi (squares, Figure 7). This permeability increases to 521 nd (test 2) when unloaded to 1000 psi. When reloaded to 8500 psi effective stress (test 4), the permeability drops to 22 nd. During the final unloading segment of the test, the permeability is 29 (test 5) and 151 nd (test 6) at effective stresses of 4500 and 1000 psi, respectively. The permeability at 1000 and 4500 psi effective stresses is much higher before being loaded to 8500 psi (tests 1–3) than it is after being loaded (tests 4, 5; Figure 7). Clearly, the permeability is dependent on the stress history of the experiment—it exhibits hysteresis.
mudstone sample is 148 nd (test 1) at an effective stress (i.e., Pc – Pp) of 4500 psi (squares, Figure 7). This permeability increases to 521 nd (test 2) when unloaded to 1000 psi. When reloaded to 8500 psi effective stress (test 4), the permeability drops to 22 nd. During the final unloading segment of the test, the permeability is 29 (test 5) and 151 nd (test 6) at effective stresses of 4500 and 1000 psi, respectively. The permeability at 1000 and 4500 psi effective stresses is much higher before being loaded to 8500 psi (tests 1–3) than it is after being loaded (tests 4, 5; Figure 7). Clearly, the permeability is dependent on the stress history of the experiment—it exhibits hysteresis.
 Figure 7. Plot showing the horizontal permeability to dodecane measured in samples from the organic-rich
 ![]() siliceous
siliceous![]() mudstone (sample PN3-108; squares) and dolomitic calcareous sandstone (sample PND-17; circles) lithofacies (as examples) at the effective stress conditions specified in our test program (see Figure 4). The arrows indicate the direction of loading and unloading paths. The vertical, gray-shaded rectangle represents the range of in situ mean effective stresses (
mudstone (sample PN3-108; squares) and dolomitic calcareous sandstone (sample PND-17; circles) lithofacies (as examples) at the effective stress conditions specified in our test program (see Figure 4). The arrows indicate the direction of loading and unloading paths. The vertical, gray-shaded rectangle represents the range of in situ mean effective stresses ( ) (1038 [7.16 MPa]–1665 psi [11.48 MPa]) inferred for the depths of the samples tested. The relationship between permeability and effective stress during the second unloading path (tests 4–6) is given by fitting the exponential relationship: k = k0 exp (−α (Pc − Pp) (Best and Katsube, 1995). In sample PND-17, the coefficients are k0 = 2122 nd and α = 0.0010 MPa−1 (coefficient of determination [R2] = 0.94) (gray dotted line); in sample PN3-108, the coefficients are k0 = 149 nd and α = 0.0366 MPa−1 (R2 = 0.83) (gray dashed line). Pc = confining pressure; Pp = pore pressure.
This behavior has been described previously for the organic-rich ![]() siliceous
siliceous![]() mudstone samples from the Wolfcamp by Bhandari et al. (2019) and for other mudstones in different formations by several authors (Dong et al., 2010; Chhatre et al., 2015; Rydzy et al., 2016; McKernan et al., 2017; King et al., 2018). Bhandari et al. (2019) attribute the permeability hysteresis to sample disturbance, damage done to the rock by the coring and sample preparation process. Microfractures are created by disturbance, and they close as the confining pressure applied on the samples is increased. For instance, in sample PN3-108, there is one bedding-parallel microfracture that traverses three-fourths of the sample length (Figure 8A) that we interpret to be caused by sample disturbance. We infer that this microfracture was open during the first part of the test program (tests 1–3, Figure 7). At increasing effective stress, the microfracture closes and the permeability decreases. When unloaded from test 4 to test 5 (Figure 7), the permeability increases by only ∼30%, suggesting that the microfracture remains mostly closed. Further unloading to test 6 results in a permeability increase of ∼400%, which we interpret to be due to a partial reopening of the microfracture.
mudstone samples from the Wolfcamp by Bhandari et al. (2019) and for other mudstones in different formations by several authors (Dong et al., 2010; Chhatre et al., 2015; Rydzy et al., 2016; McKernan et al., 2017; King et al., 2018). Bhandari et al. (2019) attribute the permeability hysteresis to sample disturbance, damage done to the rock by the coring and sample preparation process. Microfractures are created by disturbance, and they close as the confining pressure applied on the samples is increased. For instance, in sample PN3-108, there is one bedding-parallel microfracture that traverses three-fourths of the sample length (Figure 8A) that we interpret to be caused by sample disturbance. We infer that this microfracture was open during the first part of the test program (tests 1–3, Figure 7). At increasing effective stress, the microfracture closes and the permeability decreases. When unloaded from test 4 to test 5 (Figure 7), the permeability increases by only ∼30%, suggesting that the microfracture remains mostly closed. Further unloading to test 6 results in a permeability increase of ∼400%, which we interpret to be due to a partial reopening of the microfracture.
 Figure 8. Microcomputed tomography (CT) cross-sectional views of core plugs acquired after sample preparation and before conducting the permeability tests shown in Figure 7. (A) Organic-rich
 ![]() siliceous
siliceous![]() mudstone sample (PN3-108) exhibiting one artificial microfracture. (B) The dolomitic calcareous sandstone sample (PND-17) is intact. Images correspond to diametrical (left) and longitudinal (right) cross sections. The samples were CT scanned without confinement. The voxel size is ∼25 μm.
mudstone sample (PN3-108) exhibiting one artificial microfracture. (B) The dolomitic calcareous sandstone sample (PND-17) is intact. Images correspond to diametrical (left) and longitudinal (right) cross sections. The samples were CT scanned without confinement. The voxel size is ∼25 μm.
The permeability hysteresis observed in sample PN3-108 (Figure 7) is characteristic of additional core plugs that we tested from this lithofacies (Table A1, supplementary material available as AAPG Datashare 178 at
For samples that exhibit significant permeability hysteresis, we interpret that to estimate the in situ permeability under steady flow, the fractures must be closed. Therefore, the most reasonable estimate of the matrix permeability is the measurements made after the sample has been loaded to 8500 psi effective stress. In the ensuing section, we plot the permeability measurements made after the sample is loaded to 8500 psi and then after the sample is unloaded from this point to 4500 psi. Bhandari et al. (2018) used a dual permeability model and a pulsed decay permeability experiment on an Eagle Ford sample to illustrate that this approach successfully captured the matrix permeability.
The initial permeability of the dolomitic calcareous sandstone is 2054 nd (test 1) at an effective stress of 4500 psi (circles, Figure 7). This permeability remains almost constant throughout the rest of the test program. When the effective stress is increased from 1000 (test 2) to 8500 psi (test 4), the permeability decreases by ∼5%. This permeability loss almost completely recovered in tests 5 and 6. Hence, the dolomitic calcareous sandstone has systematically higher permeabilities than the mudstone, and it behaves almost perfectly elastic.
We attribute the minimal change in permeability with stress and the negligible permeability hysteresis throughout the test program to better sample quality. The micro-CT images of the tested core plug (Figure 8B) show that the sample is intact. In general, the micro-CT images acquired on additional tested core plugs from the dolomitic calcareous sandstone and other carbonate lithofacies show fewer microfractures than the organic-rich ![]() siliceous
siliceous![]() mudstone core plugs. Hence, lithofacies with high carbonate content tend to preserve their integrity during coring, resulting in little or no permeability hysteresis.
mudstone core plugs. Hence, lithofacies with high carbonate content tend to preserve their integrity during coring, resulting in little or no permeability hysteresis.
The samples were loaded in the laboratory to much higher effective stresses than are inferred to be present today in the study area (shaded region, Figure 7). This is because there is significant overpressure at this location. The in situ mean effective stress is estimated by:
where σv is the total vertical stress (psi), σh is the least principal stress (psi), and u is the pore pressure (psi). Equation 4 assumes that one of the principal stresses is vertical and that the two horizontal stresses are equal. The average overburden gradient is 1.075 psi/ft and was determined from the integration of density log data. The least principal stress was calculated from regional studies of the fracture gradient, and it lies at an average gradient of 0.86 and 0.95 psi/ft, depending on the depth of the samples. The average overpressure gradient ranges from 0.79 to 0.90 psi/ft. Based on these estimates, the for the shallowest sample (PN2-2, Table A1, supplementary material available as AAPG Datashare 178 at
Matrix Permeability by Lithofacies
Figure 9 summarizes all of the permeabilities measured at 8500 psi effective stress and then after unloading from 8500 to 4500 psi. As described above, these values are interpreted to be the best measure of the in situ horizontal effective matrix permeability to dodecane.
 Figure 9. Horizontal effective matrix permeability to dodecane (km) of all of the samples measured by lithofacies. For each lithofacies, the top and bottom lines represent the maximum and minimum values, respectively. The top and bottom edges of the gray box mark the first and third percentiles, respectively. The median value is the horizontal line within the box. Values that fall beyond the lower limit (25th percentile − 1.5 × interquartile range) and the upper limit (75th percentile + 1.5 × interquartile range) represent outliers. The n represents the number of permeability measurements conducted at confining pressure (Pc) − pore pressure (Pp) = 4500 psi (cross) and Pc − Pp = 8500 psi (circles) per lithofacies.
The organic-rich ![]() siliceous
siliceous![]() mudstone comprises 64% of the thickness of the studied section and 74% of the pore volume (Figure 6; Table A1, supplementary material available as AAPG Datashare 178 at
mudstone comprises 64% of the thickness of the studied section and 74% of the pore volume (Figure 6; Table A1, supplementary material available as AAPG Datashare 178 at ![]() siliceous
siliceous![]() mudstone strata in this region of the Delaware Basin. This supports the interpretation that our measurement protocol is capturing the in situ matrix permeabilities.
mudstone strata in this region of the Delaware Basin. This supports the interpretation that our measurement protocol is capturing the in situ matrix permeabilities.

The argillaceous mudstone is the second most frequent mudstone lithofacies, and it comprises 18% of the stratigraphic thickness and 20% of the pore volume (Figure 6; Table A1, supplementary material available as AAPG Datashare 178 at
The carbonates as a whole make up only 18% of the section and 6% of the pore volume (Figure 6; Table A1, supplementary material available as AAPG Datashare 178 at ![]() siliceous
siliceous![]() mudstone (38, 30, and 21 nd, respectively) (Table 2). The calcareous sandstone and dolomudstone lithofacies have much lower kmedian of 3 nd (Table 2). However, what is striking is that the calcareous mudstone and the calcareous sandstone lithofacies, when dolomitic (i.e., dolomitic calcareous mudstone and dolomitic calcareous sandstone), have systematically higher permeabilities than the rest of the lithofacies. The kmedian is 216 and 904 nd in the dolomitic calcareous mudstone and dolomitic calcareous sandstone lithofacies, respectively (Table 2).
mudstone (38, 30, and 21 nd, respectively) (Table 2). The calcareous sandstone and dolomudstone lithofacies have much lower kmedian of 3 nd (Table 2). However, what is striking is that the calcareous mudstone and the calcareous sandstone lithofacies, when dolomitic (i.e., dolomitic calcareous mudstone and dolomitic calcareous sandstone), have systematically higher permeabilities than the rest of the lithofacies. The kmedian is 216 and 904 nd in the dolomitic calcareous mudstone and dolomitic calcareous sandstone lithofacies, respectively (Table 2).
Pore Scale Controls on Permeability
We next explore the pore scale characteristics of each lithofacies that may contribute to the permeability that is observed.
Organic-Rich  Siliceous
 Mudstone
The organic-rich ![]() siliceous
siliceous![]() mudstone is primarily composed of clay- to silt-size detrital, biogenic, and microcrystalline quartz within a clay-rich matrix (Figure 10A). The organic matter occurs as micrometer-size detrital particles (Figure 10A) and occupies the interparticle pores between grains (Figure 10B). A rigid framework of silt-size grains and clays often encloses the organic matter (Figure 10C, D).
mudstone is primarily composed of clay- to silt-size detrital, biogenic, and microcrystalline quartz within a clay-rich matrix (Figure 10A). The organic matter occurs as micrometer-size detrital particles (Figure 10A) and occupies the interparticle pores between grains (Figure 10B). A rigid framework of silt-size grains and clays often encloses the organic matter (Figure 10C, D).
 Figure 10. Organic-rich
 ![]() siliceous
siliceous![]() mudstone lithofacies: field emission-scanning electron microscopy (SEM) images of argon ion beam milled sample. (A) Low-magnification color energy-dispersive spectroscopy elemental map (Al is green, Si is red, Ca is dark blue, Na is aqua, and Mg is magenta) superimposed on backscattered electron (BSE)-SEM image showing silt quartz (q), albite (ab), dolomite (d), calcite (ca), clays (cl), clay-mineral aggregate (cla), mica (m), potassium feldspar (k), pyrite (py) and organic matter (OM). Sample PN3-108. (B) Enlargement of yellow-framed area in (A). Organic matter fills most pores between clay- to silt-size matrix components (yellow arrows). (C) Enlargement of yellow-framed area in (B) showing porous organic matter particle enclosed by clays and other rigid grains in the matrix. (D) Image showing intraparticle (intraP) pores within the organic matter. Sample PN3-108. (E) Image showing interparticle pores between clays and other grains. Sample PN6-75. (F) Image of intraparticle pores within potassium feldspar. We interpret that the partial dissolution of the potassium feldspar formed these pores. The potassium feldspar grains shown in the image correspond to the nondissolved areas of the mineral. Sample PN6-75. BSED = backscattered electron detector; det = detector; HFW = horizontal field width; HV = high voltage (accelerating voltage); mag = magnification; spot = spot size; WD = working distance.
mudstone lithofacies: field emission-scanning electron microscopy (SEM) images of argon ion beam milled sample. (A) Low-magnification color energy-dispersive spectroscopy elemental map (Al is green, Si is red, Ca is dark blue, Na is aqua, and Mg is magenta) superimposed on backscattered electron (BSE)-SEM image showing silt quartz (q), albite (ab), dolomite (d), calcite (ca), clays (cl), clay-mineral aggregate (cla), mica (m), potassium feldspar (k), pyrite (py) and organic matter (OM). Sample PN3-108. (B) Enlargement of yellow-framed area in (A). Organic matter fills most pores between clay- to silt-size matrix components (yellow arrows). (C) Enlargement of yellow-framed area in (B) showing porous organic matter particle enclosed by clays and other rigid grains in the matrix. (D) Image showing intraparticle (intraP) pores within the organic matter. Sample PN3-108. (E) Image showing interparticle pores between clays and other grains. Sample PN6-75. (F) Image of intraparticle pores within potassium feldspar. We interpret that the partial dissolution of the potassium feldspar formed these pores. The potassium feldspar grains shown in the image correspond to the nondissolved areas of the mineral. Sample PN6-75. BSED = backscattered electron detector; det = detector; HFW = horizontal field width; HV = high voltage (accelerating voltage); mag = magnification; spot = spot size; WD = working distance.
This lithofacies has abundant interparticle pores between clays and quartz microcrystals, and between other clay- to silt-size particles (Figure 10E). We calculated the equivalent circular diameter (Deq) of the pores by measuring the pore area in the SEM images using ImageJ (Abràmoff et al., 2004) and computing its equivalent diameter (assuming it has a circular section). Most pores have an equivalent diameter smaller than 300 nm. The intraparticle pores occur primarily within the organic matter (Figure 10C, D). These are irregular ellipsoids; their Deq ranges from 300 (Figure 10C) to less than 50 nm (Figure 10D). Similar organic matter pores have been observed in other formations and are interpreted to have formed during the thermal maturation of organic matter (Loucks et al., 2009; Passey et al., 2010; Schieber, 2010; Bernard et al., 2012b; Curtis et al., 2012). We observed some larger intraparticle pores with an equivalent diameter of up to 2000 nm; these are often associated with potassium feldspars (Figure 10F). We interpret that these larger pores were formed by partial dissolution of the potassium feldspars. Intraparticle pores within clay aggregates, micas, and other rock components are also present, but they are not volumetrically significant.
We interpret that the size of interparticle pores and intraparticle pores within potassium feldspars control permeability in this lithofacies. We tested eight organic-rich ![]() siliceous
siliceous![]() mudstone samples and found that the permeability varied from 5 to 57 nd (Figure 9; Table 2). Two of the organic-rich
mudstone samples and found that the permeability varied from 5 to 57 nd (Figure 9; Table 2). Two of the organic-rich ![]() siliceous
siliceous![]() mudstone samples with the highest permeability (sample PN3-33 and sample PN6-75; Table A1, supplementary material available as AAPG Datashare 178 at
mudstone samples with the highest permeability (sample PN3-33 and sample PN6-75; Table A1, supplementary material available as AAPG Datashare 178 at
The TOC content in sample PN3-108 (km = 22–29 nd; Figure 7; Table A1, supplementary material available as AAPG Datashare 178 at
The mercury injection capillary pressure (MICP) data experiments support the interpretation that samples with larger interparticle pores have higher permeability (Figure 11A, B). For example, sample PN3-108, which has a higher measured permeability (km = 22–29 nd; Table A1, supplementary material available as AAPG Datashare 178 at
 Figure 11. Drainage capillary pressure and pore throat size distribution curves in samples tested for permeability. (A, B) Organic-rich
 ![]() siliceous
siliceous![]() mudstone samples PN5-12 (km = 7 to 9 nd) and PN3-108 (km = 22 to 29 nd). (C, D) Sample PND-3 (km km = 422–508 nd) from the dolomitic calcareous mudstone lithofacies, and sample PND-17 (km = 2004–2041 nd) from the dolomitic calcareous sandstone lithofacies. Curves were obtained using mercury injection capillary pressure (MICP) measurements on whole sample in PN5-12, and crushed samples in PN3-108, PND-3, PN4-18-1, and PND-17. φHg = MICP porosity; Dt = modal pore throat diameter; km = horizontal effective matrix permeability to dodecane; Pde = extrapolated displacement pressure determined from a hyperbolic fit to the displacement curve and its projection to a horizontal asymptote (see Thomeer, 1960); Pt = threshold pressure; Vp = pore volume.
mudstone samples PN5-12 (km = 7 to 9 nd) and PN3-108 (km = 22 to 29 nd). (C, D) Sample PND-3 (km km = 422–508 nd) from the dolomitic calcareous mudstone lithofacies, and sample PND-17 (km = 2004–2041 nd) from the dolomitic calcareous sandstone lithofacies. Curves were obtained using mercury injection capillary pressure (MICP) measurements on whole sample in PN5-12, and crushed samples in PN3-108, PND-3, PN4-18-1, and PND-17. φHg = MICP porosity; Dt = modal pore throat diameter; km = horizontal effective matrix permeability to dodecane; Pde = extrapolated displacement pressure determined from a hyperbolic fit to the displacement curve and its projection to a horizontal asymptote (see Thomeer, 1960); Pt = threshold pressure; Vp = pore volume.
Argillaceous Mudstone
The argillaceous mudstone lithofacies is primarily composed of clays and clay- to silt-size detrital quartz and dolomite crystals (Figure 12A, B). The organic matter is scattered throughout the matrix (Figure 12C) or mixed with clays (Figure 12D). This lithofacies has lower TOC content (0.65 wt. %, Table A2, supplementary material available as AAPG Datashare 178 at ![]() siliceous
siliceous![]() mudstone lithofacies.
mudstone lithofacies.
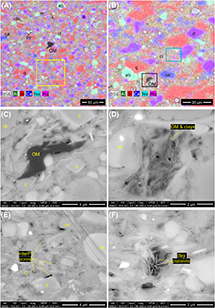 Figure 12. Argillaceous mudstone lithofacies: field emission-scanning electron microscopy (SEM) images of argon ion beam milled sample. (A) Low-magnification color energy-dispersive spectroscopy elemental map (Al is green, Si is red, Ca is dark blue, Na is aqua, and Mg is magenta) superimposed on backscattered electron (BSE)-SEM image showing silt quartz (q), albite (ab), dolomite (d), calcite (ca), clays (cl), clay-mineral aggregate (cla), mica (m), potassium feldspar (k), pyrite (py) and organic matter (OM). (B) Enlargement of yellow-framed area in (A), showing that clays dominate the composition of this lithofacies. Clay- to silt-size grains of detrital quartz and dolomite crystals are scattered throughout the rock. (C) Enlargement of black-framed area in (B) showing a deformed organic matter particle surrounded by clays and other grains in the matrix. This organic matter particle has only a few intraparticle pores. (D) Enlargement of green-framed area in (B) showing porous organic matter intermixed with abundant clays. (E) Enlargement of blue-framed area in (B) showing nanometer-size interparticle pores between clays and between clays and other grains. (F) Enlargement of red-framed area in (B) showing interparticle pores between randomly oriented clays. All of the images are from sample PND-3. BSED = backscattered electron detector; det = detector; HFW = horizontal field width; HV = high voltage (accelerating voltage); mag = magnification; spot = spot size; WD = working distance.
Interparticle pores between clays (Figure 12E) dominate the pore system in this lithofacies. Their Deq is typically smaller than 300 nm. They generally have a polygonal shape, with straight edges between randomly oriented clay platelets (Figure 12F). Interparticle pores between clays and other grains (Figure 12E) and intraparticle pores within the organic matter (Figure 12C, D) are less abundant than the interparticle pores between clays. Therefore, we infer that fluid flow occurs primarily through the interparticle pores between clays.
The measured permeability of this lithofacies is extremely low (km = 0.1–2 nd; Figure 9; Table 2) compared to the organic-rich ![]() siliceous
siliceous![]() mudstone permeability (km = 5–57 nd; Figure 9; Table 2). However, the MICP data (Figure 11C, D) show that the pore throat size distributions are almost similar for these two lithofacies. The displacement pressure in this mudstone is smaller (Pde = 9962 psi; Figure 11C) and the modal pore throat size is slightly larger (Dt = 13 nm; Figure 11D) than in the organic-rich
mudstone permeability (km = 5–57 nd; Figure 9; Table 2). However, the MICP data (Figure 11C, D) show that the pore throat size distributions are almost similar for these two lithofacies. The displacement pressure in this mudstone is smaller (Pde = 9962 psi; Figure 11C) and the modal pore throat size is slightly larger (Dt = 13 nm; Figure 11D) than in the organic-rich ![]() siliceous
siliceous![]() mudstone (sample PN5-12, Pde = 12,791 psi, Dt = 11 nm, km = 7–9 nd; Figure 11A, B). We infer that our measured permeability to dodecane for the argillaceous mudstone is extremely low because there is a significant water saturation in the sample. The pore volume in the argillaceous mudstone sample is ∼80% liquid saturated (Table A1, supplementary material available as AAPG Datashare 178 at
mudstone (sample PN5-12, Pde = 12,791 psi, Dt = 11 nm, km = 7–9 nd; Figure 11A, B). We infer that our measured permeability to dodecane for the argillaceous mudstone is extremely low because there is a significant water saturation in the sample. The pore volume in the argillaceous mudstone sample is ∼80% liquid saturated (Table A1, supplementary material available as AAPG Datashare 178 at
Dolomitic Calcareous Mudstone and Dolomitic Calcareous Sandstone
The dolomitic calcareous mudstone and dolomitic calcareous sandstone lithofacies are composed of dolomite rhombic crystals and dolomitized ![]() microfossils
microfossils![]() separated by detrital and microcrystalline quartz and other grains (Figures 13A; 14A, C). The dolomitic calcareous sandstone has
separated by detrital and microcrystalline quartz and other grains (Figures 13A; 14A, C). The dolomitic calcareous sandstone has ![]() microfossils
microfossils![]() larger than 62.5 µm, has low clay content (www.aapg.org/datashare), and is located in the lower-to-middle parts of the dolomitized carbonate flow deposit (Ramiro-Ramirez, 2022). In contrast, the dolomitic calcareous mudstone generally has
larger than 62.5 µm, has low clay content (www.aapg.org/datashare), and is located in the lower-to-middle parts of the dolomitized carbonate flow deposit (Ramiro-Ramirez, 2022). In contrast, the dolomitic calcareous mudstone generally has ![]() microfossils
microfossils![]() smaller than 62.5 µm, has higher clay content (>9 wt. %, Table A2), and is located in the middle-to-upper parts of dolomitized flow deposit (see Ramiro-Ramirez, 2022).
smaller than 62.5 µm, has higher clay content (>9 wt. %, Table A2), and is located in the middle-to-upper parts of dolomitized flow deposit (see Ramiro-Ramirez, 2022).
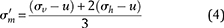
 Figure 13. Dolomitic calcareous mudstone lithofacies: field emission-scanning electron microscopy (SEM) images of argon ion beam milled samples. (A) Low-magnification color energy-dispersive spectroscopy elemental map (Al is green, Si is red, Ca is dark blue, Na is aqua, and Mg is magenta) superimposed on backscattered electron (BSE)-SEM image showing quartz (q), albite (ab), dolomite (d), calcite (ca), and pyrite (py). Dolomite occurs as rhombic crystals or as dolomitized
 ![]() microfossils
microfossils![]() with micrometer-size intraparticle (intraP) pores. Sample PN4-18-1. (B) Enlargement of yellow-framed area in (A) showing micrometer-size intraparticle pore within dolomitized microfossil. (C) Polygonal intraparticle pores within dolomitized microfossil. Sample PN4-18-1. (D) Enlargement of black-framed area in (A) showing clay-size quartz microcrystals mixed with silt-size detrital quartz and other clay- to silt-size rock components. (E) High-magnification image showing clay-size microcrystalline quartz and other clay-size grains. Porous organic matter (OM) fills some of the interparticle pores. Sample PN4-18-1. (F) Through-lens detector image showing interparticle pores between microcrystalline quartz and other grain components. Same field of view as (E). BSED = backscattered electron detector; det = detector; HFW = horizontal field width; HV = high voltage (accelerating voltage); mag = magnification; spot = spot size; WD = working distance.
with micrometer-size intraparticle (intraP) pores. Sample PN4-18-1. (B) Enlargement of yellow-framed area in (A) showing micrometer-size intraparticle pore within dolomitized microfossil. (C) Polygonal intraparticle pores within dolomitized microfossil. Sample PN4-18-1. (D) Enlargement of black-framed area in (A) showing clay-size quartz microcrystals mixed with silt-size detrital quartz and other clay- to silt-size rock components. (E) High-magnification image showing clay-size microcrystalline quartz and other clay-size grains. Porous organic matter (OM) fills some of the interparticle pores. Sample PN4-18-1. (F) Through-lens detector image showing interparticle pores between microcrystalline quartz and other grain components. Same field of view as (E). BSED = backscattered electron detector; det = detector; HFW = horizontal field width; HV = high voltage (accelerating voltage); mag = magnification; spot = spot size; WD = working distance.
 Figure 14. Dolomitic calcareous sandstone lithofacies: field emission-scanning electron microscopy (SEM) images of argon ion beam milled samples. (A) Low-magnification color energy-dispersive spectroscopy (EDS) elemental map (Al is green, Si is red, Ca is dark blue, Na is aqua, and Mg is magenta) superimposed on backscattered electron (BSE)-SEM image showing quartz (q), albite (ab), dolomite (d), calcite (ca), pyrite (py), and micrometer-size intraparticle (intraP) pores within dolomitized
 ![]() microfossils
microfossils![]() . Sample PN6-36. (B) Enlargement of yellow-framed area in (A) showing intraparticle pores within dolomitized microfossil filled with organic matter (OM). (C) Low-magnification color EDS elemental map superimposed on BSE-SEM image showing silt quartz (q), microcrystalline quartz, albite (ab), dolomite (d), calcite (ca), pyrite (py), intraparticle pores (intraP) within dolomite crystals, and micrometer-size interparticle (interP) pores between dolomite and quartz. Sample PND-17. (D) Enlargement of red-framed area in (C) showing micrometer-size interP pores between dolomite crystals and quartz, submicrometer-size interP between quartz microcrystals, and intraP pores within dolomite crystals. (E) High-magnification view of microcrystalline quartz between dolomite crystals. Sample PND-17. (F) Everhart–Thornley detector (ETD) image showing interparticle pores between quartz microcrystals and intraparticle pores within dolomite crystals. Same field of view as (E). BSED = backscattered electron detector; det = detector; HFW = horizontal field width; HV = high voltage (accelerating voltage); mag = magnification; spot = spot size; WD = working distance.
. Sample PN6-36. (B) Enlargement of yellow-framed area in (A) showing intraparticle pores within dolomitized microfossil filled with organic matter (OM). (C) Low-magnification color EDS elemental map superimposed on BSE-SEM image showing silt quartz (q), microcrystalline quartz, albite (ab), dolomite (d), calcite (ca), pyrite (py), intraparticle pores (intraP) within dolomite crystals, and micrometer-size interparticle (interP) pores between dolomite and quartz. Sample PND-17. (D) Enlargement of red-framed area in (C) showing micrometer-size interP pores between dolomite crystals and quartz, submicrometer-size interP between quartz microcrystals, and intraP pores within dolomite crystals. (E) High-magnification view of microcrystalline quartz between dolomite crystals. Sample PND-17. (F) Everhart–Thornley detector (ETD) image showing interparticle pores between quartz microcrystals and intraparticle pores within dolomite crystals. Same field of view as (E). BSED = backscattered electron detector; det = detector; HFW = horizontal field width; HV = high voltage (accelerating voltage); mag = magnification; spot = spot size; WD = working distance.
Both lithofacies have a similar pore system consisting of intraparticle pores within dolomitized ![]() microfossils
microfossils![]() and dolomite crystals, and interparticle pores between quartz microcrystals and other grains. Intraparticle pores within dolomitized
and dolomite crystals, and interparticle pores between quartz microcrystals and other grains. Intraparticle pores within dolomitized ![]() microfossils
microfossils![]() exhibit irregular polygonal shapes with straight margins (Figures 13A–C; 14A, B). Their Deq is up to 18,000 nm. These pores may host migrated organic matter (Figure 14B), indicating that they were most likely connected to the effective pore system during hydrocarbon migration. The intraparticle pores within dolomite crystals have a Deq that is typically smaller than 500 nm. The intraparticle pores within dolomitized
exhibit irregular polygonal shapes with straight margins (Figures 13A–C; 14A, B). Their Deq is up to 18,000 nm. These pores may host migrated organic matter (Figure 14B), indicating that they were most likely connected to the effective pore system during hydrocarbon migration. The intraparticle pores within dolomite crystals have a Deq that is typically smaller than 500 nm. The intraparticle pores within dolomitized ![]() microfossils
microfossils![]() pores were probably formed by dissolution, whereas the intraparticle pores within dolomite crystals are fluid inclusions, dissolution pores, or both. The interparticle pores dominate the pore system in these two lithofacies. They are predominantly between quartz microcrystals (Figures 13E, F; 14E, F), and some are filled with porous organic matter. Their Deq is typically up to 1000 nm. In the calcareous sandstone lithofacies, interparticle pores between dolomite crystals and quartz exhibit Deq up to 40,000 nm (Figure 14D). These larger pores resemble cavities, and there are no signs of collapse into them.
pores were probably formed by dissolution, whereas the intraparticle pores within dolomite crystals are fluid inclusions, dissolution pores, or both. The interparticle pores dominate the pore system in these two lithofacies. They are predominantly between quartz microcrystals (Figures 13E, F; 14E, F), and some are filled with porous organic matter. Their Deq is typically up to 1000 nm. In the calcareous sandstone lithofacies, interparticle pores between dolomite crystals and quartz exhibit Deq up to 40,000 nm (Figure 14D). These larger pores resemble cavities, and there are no signs of collapse into them.
We interpret that the pore system observed in the dolomitic calcareous mudstone and dolomitic calcareous sandstone developed in the following manner. First, dolomite replacement occurred in the carbonate flow deposit during shallow burial, based on the formation temperatures of 30°C to 50°C estimated by Dobber and Goldstein (2020) in similar Wolfcamp dolomite to those observed petrographically here. This early dolomitization may be explained by the organogenic model (Mazzullo, 2000). Precipitation of microcrystalline quartz in the interparticle pores of the carbonate flow deposit also occurred during shallow burial. The microcrystalline quartz prevented compaction of the deposit throughout burial, and the effective porosity and permeability were preserved. Second, late-stage iron-rich dolomitization occurred, as evidenced by the presence of (1) iron-rich zones surrounding or completely replacing a magnesium-rich core in dolomite crystals, and (2) the iron-rich dolomite composition of the ![]() microfossils
microfossils![]() (Figure 15). Finally, fluids lacking magnesium or acidified pore waters entered the dolomitized carbonate deposit and partially dissolved the dolomitized
(Figure 15). Finally, fluids lacking magnesium or acidified pore waters entered the dolomitized carbonate deposit and partially dissolved the dolomitized ![]() microfossils
microfossils![]() , forming the intraparticle pores. During this stage, the micrometer-scale interparticle pores in the dolomitic calcareous sandstone may have formed by complete dissolution of dolomitized
, forming the intraparticle pores. During this stage, the micrometer-scale interparticle pores in the dolomitic calcareous sandstone may have formed by complete dissolution of dolomitized ![]() microfossils
microfossils![]() or by progressive dissolution and enlargement of former pores that connected to high-permeability pathways in the rock. Fredd and Fogler (1998) describe a similar pore growth mechanism by which the flow and reaction of certain fluids (e.g., acids) with carbonate porous media result in formation of highly conductive flow channels (i.e., wormholes).
or by progressive dissolution and enlargement of former pores that connected to high-permeability pathways in the rock. Fredd and Fogler (1998) describe a similar pore growth mechanism by which the flow and reaction of certain fluids (e.g., acids) with carbonate porous media result in formation of highly conductive flow channels (i.e., wormholes).
 Figure 15. Color energy-dispersive spectroscopy elemental map (Ca is dark blue, Mg is magenta, and Fe is yellow) superimposed on field emission-scanning electron microscopy backscattered electron (BSE) image of argon ion beam milled sample from dolomitic calcareous mudstone lithofacies showing Fe-rich dolomite rims surrounding a Mg-rich core in dolomite crystals, and Fe-rich dolomitized
 ![]() microfossils
microfossils![]() . Sample PN2-52.
. Sample PN2-52.
We observe that the larger pore throats in the dolomitic calcareous sandstone result in the higher measured permeabilities. The permeabilities of dolomitic calcareous mudstone samples are between 7 and 508 nd, with kmedian = 216 nd, whereas samples from the dolomitic calcareous sandstone have permeabilities between 33 and 2041 nd, with kmedian = 904 nd (Figure 9; Table 2). The dolomitic calcareous sandstone sample PND-17 (km = 2004–2041 nd; Table A1, supplementary material available as AAPG Datashare 178 at
It is interesting to compare sample PN4-18-1 and sample PN3-108 (dolomitic calcareous mudstone versus organic-rich ![]() siliceous
siliceous![]() mudstone). Sample PN 4-18-1 is ∼20 times more permeable (km = 422–508 nd; Table A1, supplementary material available as AAPG Datashare 178 at
mudstone). Sample PN 4-18-1 is ∼20 times more permeable (km = 422–508 nd; Table A1, supplementary material available as AAPG Datashare 178 at ![]() siliceous
siliceous![]() mudstone (Dt = 13 nm at incremental mercury volume of 8.5%), resulting in a higher measured permeability. We infer that these pore throats correspond to the interparticle pores between quartz microcrystals (Figure 13E, F). We suggest that pervasive precipitation of microcrystalline quartz during early burial prevented the rock from compacting and preserved an effectively connected interparticle pore volume. These data further support our interpretation that the interparticle pore volume is a primary control for permeability.
mudstone (Dt = 13 nm at incremental mercury volume of 8.5%), resulting in a higher measured permeability. We infer that these pore throats correspond to the interparticle pores between quartz microcrystals (Figure 13E, F). We suggest that pervasive precipitation of microcrystalline quartz during early burial prevented the rock from compacting and preserved an effectively connected interparticle pore volume. These data further support our interpretation that the interparticle pore volume is a primary control for permeability.
FLOW MODEL IN WOLFCAMP STRATA
Conceptual Reservoir Model for Wolfcamp Strata
A conceptual reservoir model for Wolfcamp strata at the scale of a single hydraulic fracture is shown in Figure 16. The interval is dominated by porous (φt,median = 12.0%, Figure 5, Table A1, supplementary material available as AAPG Datashare 178 at ![]() siliceous
siliceous![]() mudstones that store the majority of the oil. Interbedded with these mudstones are relatively thin dolomitized carbonate flow deposits that have low porosity (φt,median = 5.1%; Figure 5; Table A1) and high permeability (kmedian = 216–904 nd; Table 2). We infer that these permeable beds are laterally continuous at the scale of at least 100 ft, which is a typical spacing between hydraulic fractures (e.g., Weijermars et al., 2020). In this environment, hydraulic fractures would intersect one or more of these permeable beds (Figure 16).
mudstones that store the majority of the oil. Interbedded with these mudstones are relatively thin dolomitized carbonate flow deposits that have low porosity (φt,median = 5.1%; Figure 5; Table A1) and high permeability (kmedian = 216–904 nd; Table 2). We infer that these permeable beds are laterally continuous at the scale of at least 100 ft, which is a typical spacing between hydraulic fractures (e.g., Weijermars et al., 2020). In this environment, hydraulic fractures would intersect one or more of these permeable beds (Figure 16).
 Figure 16. Hydrostratigraphic model of the Wolfcamp showing a horizontal well and two hydraulic fractures. We represent each hydraulic fracture stage as a single planar hydraulic fracture. The horizontal layers represent the permeable dolomitized carbonate flow deposits. The strata between these permeable layers correspond to the low-permeability organic-rich
 ![]() siliceous
siliceous![]() mudstones. Hydraulic fractures intersect both the high- and low-permeability layers; during production, the more permeable layers drain fluids from the mudstones (red arrows) due to cross-facies flow. The green rectangle represents the model domain described in Figure 19. The thickness of permeable flow deposits and the width of hydraulic fractures and well are not to scale.
mudstones. Hydraulic fractures intersect both the high- and low-permeability layers; during production, the more permeable layers drain fluids from the mudstones (red arrows) due to cross-facies flow. The green rectangle represents the model domain described in Figure 19. The thickness of permeable flow deposits and the width of hydraulic fractures and well are not to scale.
In fact, we infer that the permeable dolomitic lithofacies may extend much further than the distance between hydraulic fractures. For example, Figure 17 shows a dolomitized carbonate turbidite present at well L and well N. Based on the log signature, we correlate this bed to well S, where no core is present. This correlation suggests that some of these deposits may extend over several miles (e.g., 12 mi). In turn, this implies that dolomitization may have occurred at the regional scale. In the Wolfcamp A, the dolomitic calcareous mudstone and dolomitic calcareous sandstone are more frequent than in the Wolfcamp B and are often amalgamated. Hence, it is not possible to confidently correlate individual dolomitized carbonate deposits in the Wolfcamp A unit (see Ramiro-Ramirez, 2022).
 Figure 17. Correlated dolomitic calcareous mudstone and dolomitic calcareous sandstone lithofacies (dolomitized carbonate deposits) across well L, well S, and well N in a depth interval of the Wolfcamp B unit. Dark magenta represents dolomitized carbonate flow deposits defined in core, and the light magenta represents the inferred correlation of these deposits. The core photographs illustrate an example of a correlated dolomitized carbonate deposit between wells L and N. The distance between well L and well S is 13 mi, between well L and well N is 11 mi, and between well N and well S is 7 mi. See Ramiro-Ramirez (2022) for well locations. Track 1: gamma ray (GR) (green), cored interval (red vertical bar). Track 2: deep resistivity (Res). Track 3: bulk density (Rhob) (red) and neutron porosity (blue). Track 4: photoelectric effect (Pef).
Net-to-Gross of Dolomitized Carbonate Deposits
The number, thickness, and distribution of the dolomitized carbonate deposits will impact the drainage of the reservoir because of their high permeability. In the Wolfcamp B unit, these deposits have an average thickness of 1.3 ft and are separated by low-permeability strata, the average thickness of which is 22.0 ft (Figure 18A). In general, the net-to-gross (NG) profile of dolomitized carbonate deposits to low-permeability strata is less than 0.1 in this unit (Figure 18B). However, certain intervals have a higher frequency of permeable deposits, resulting in NG > 0.1. In the Wolfcamp A unit, the dolomitized carbonate deposits are thicker (average thickness is 2.8 ft) and more frequent (average thickness of low-permeability strata is 13.5 ft) than in the Wolfcamp B (Figure 18A). This translates into a higher NG, typically more than 0.1 (Figure 18B).
 Figure 18. Lithofacies distribution, thickness, and net-to-gross (NG) ratio of the high-permeability (perm) layers in the upper Wolfcamp. (A) Lithofacies distribution and thickness of low-perm deposits (blue line) and high-permeability dolomitized carbonate deposits (orange line) in the Wolfcamp B and Wolfcamp A units. The permeable deposits are the dolomitic calcareous mudstone and dolomitic calcareous sandstone lithofacies (magenta). (B) The NG profile of high-perm deposits to low-perm strata. The NG was calculated using half the thickness of the deposits (h1/2).
Flow Model and Drainage Behavior
Model Description
We constructed a finite element model (Figure 19B) in COMSOL Multiphysics® software (COMSOL, 2016) to simulate the flow behavior during production of the reservoir envisioned in Figure 16. Low-permeability layers of constant thickness are interbedded with high-permeability layers of constant thickness. Under these conditions, it is appropriate to extract a single domain (red dashed lines, Figure 19A) and model this system with no flow boundaries at the top, right side, and base with all of the flow occurring into the fracture. This simplification is possible because of the symmetry of the problem—there is no flow at the top, base, and right side because at these interfaces, the pressure gradient will be zero.
 Figure 19. Schematic of layered model. (A) The layered modeled consists of high-permeability layers interbedded with low-permeability strata. (B) The modeled domain is composed of a high-permeability layer (blue) and a low-permeability layer (gray). We model half the thickness of each layer. The length of the model (L) is half the distance between hydraulic fractures. We discretized the low-permeability layer into 3460 triangular elements and a total mesh area of 31.2 m2, and the high-permeability layer into 810 triangular elements and a total mesh area of 6.5 m2. φ1 = layer 1 total porosity; φ2 = layer 2 total porosity; h1 = layer 1 thickness; h2 = layer 2 thickness; kh1 = layer 1 horizontal permeability; kh2 = layer 2 horizontal permeability; kv1 = layer 1 vertical permeability; kv2 = layer 2 vertical permeability; pf = pressure at the producing face (hydraulic fracture); pi = initial reservoir pressure.
We assume (1) single phase flow, (2) gravity effects are negligible, (3) flow follows Darcy’s law, (4) the bulk rock is incompressible, (5) the fluid properties are constant, (6) properties are homogenous in each layer, and (7) permeability is isotropic along the horizontal axis.
The flow behavior is described as:
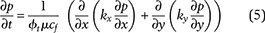
where p = fluid pressure (Pa), t = time (s), kx = permeability in x direction (m2), ky = permeability in y direction (m2), φt = total porosity (dec), μ = fluid viscosity (Pa · s), and cf = fluid compressibility (Pa−1).
The model has a domain of length L that is composed of two layers of thickness h1 and h2 (Figure 19B). Layer 1 represents the high-porosity low-permeability organic-rich ![]() siliceous
siliceous![]() mudstone and layer 2 represents the permeable dolomitized carbonate deposits. There is no flow across the top, bottom, and right boundaries. Pressure at the left boundary is fixed to simulate the interface between the hydraulic fracture and the reservoir. The initial pressure of the reservoir is pi. At t ≤ 0, the pressure at the left boundary is pi. At t > 0, the pressure at the left boundary is pf, the pressure the well is drawn down to during production. The length of the model domain (L) is assumed to equal 50 ft. We chose values of porosity and permeability based on our porosity and permeability measurements (Table 3). Layer 1 is assumed to have the median porosity (12.0%) and median permeability (20 nd) of the organic-rich
mudstone and layer 2 represents the permeable dolomitized carbonate deposits. There is no flow across the top, bottom, and right boundaries. Pressure at the left boundary is fixed to simulate the interface between the hydraulic fracture and the reservoir. The initial pressure of the reservoir is pi. At t ≤ 0, the pressure at the left boundary is pi. At t > 0, the pressure at the left boundary is pf, the pressure the well is drawn down to during production. The length of the model domain (L) is assumed to equal 50 ft. We chose values of porosity and permeability based on our porosity and permeability measurements (Table 3). Layer 1 is assumed to have the median porosity (12.0%) and median permeability (20 nd) of the organic-rich ![]() siliceous
siliceous![]() mudstone. Layer 2 is assumed to have the median porosity (5.0%) and median permeability (560 nd) of the dolomitic calcareous lithofacies. We assume the vertical permeability is 10 times less than the horizontal permeability in layer 1, based on our vertical and horizontal permeability measurements in two contiguous vertical and horizontal core plugs from the organic-rich
mudstone. Layer 2 is assumed to have the median porosity (5.0%) and median permeability (560 nd) of the dolomitic calcareous lithofacies. We assume the vertical permeability is 10 times less than the horizontal permeability in layer 1, based on our vertical and horizontal permeability measurements in two contiguous vertical and horizontal core plugs from the organic-rich ![]() siliceous
siliceous![]() mudstone lithofacies (samples PN5-12 and PN5-12V, and PN6-75 and PN6-75V; Table A1, supplementary material available as AAPG Datashare 178 at
mudstone lithofacies (samples PN5-12 and PN5-12V, and PN6-75 and PN6-75V; Table A1, supplementary material available as AAPG Datashare 178 at

The reservoir fluid properties (e.g., density and viscosity) are temperature and pressure dependent. In the simulations, we used Wolfcamp crude oil properties for the typical Wolfcamp reservoir temperature condition (∼150°F) and the average pressure condition in our model (∼4500 psi) (see Mavor, 2014) (Table 3).
The average thickness of the high-permeability dolomitized carbonates in the Wolfcamp A is 2.8 ft and the average thickness of the low-permeability strata is 13.5 ft. In the Wolfcamp B, the average thickness of the high-permeability dolomitized carbonates is 1.3 ft, whereas the average thickness of the low-permeability strata is 22.0 ft. We assumed that the height of each layer in the model is half the average bed thickness (Figure 19B). Hence, the thickness of the low-permeability and high-permeability layers in the Wolfcamp A are h1 = 6.7 ft and h2 = 1.4 ft, respectively. In the Wolfcamp B, the thickness of the low-permeability and high-permeability layers are h1 = 11.0 ft and h2 = 0.6 ft, respectively. Table 3 summarizes the model parameters for Wolfcamp A and Wolfcamp B.
Simulation Results
Figure 20 illustrates the pressure evolution and flow orientation and magnitude (black arrows) at three different times during the simulations conducted in the Wolfcamp A model. Initially, the pressure in both layers is pi = 6000 psi. With time, the pressure dissipates in both layer 1 and layer 2 as fluids are produced at the left boundary. However, the pressure dissipates faster in layer 2 than in layer 1 (e.g., t = 0.1 yr), generating a vertical pressure gradient between both layers. Significant amounts of flow are diverted upward into the high-permeability layer 2 (e.g., t = 1 yr). These fluids are then transported horizontally toward the fracture. The pressure in the low-permeability layer 1 continues dissipating in both the horizontal and vertical directions until the pressure in the entire reservoir equilibrates with fracture pressure (pf). Not surprisingly, at any particular time the pressure is more depleted near the fracture face (left) than on the no-flow boundary at the far right.
 Figure 20. Example of fluid pressure evolution within the domain of each layer at t = 0.1, 1, and 5 yr. The arrows show the orientation and magnitude of the flow in logarithmic scale. The horizontal axis is the reservoir length, and the vertical axis is sum of the layer 1 (bottom layer) and layer 2 (top layer) thicknesses. Results in this figure correspond to the Wolfcamp A model (see Table 3).
The amount of flow across the left boundary is plotted in Figure 21. This is represented with a dimensionless recovery factor (RF):
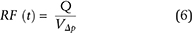
 Figure 21. Flow simulation results for the layered model (see Figure 19B). The black curve is the cumulative production when there is cross-facies flow in the Wolfcamp A model. The red curve is the cumulative production when there is no cross-facies flow, and it represents the lower bound performance in the Wolfcamp A model. The gray curve is the cumulative production when there is cross-facies flow, and the permeability in the high-permeability layer is very high (i.e., 109 nd); it represents the upper bound performance in the Wolfcamp A model. The blue curve is the cumulative production when there is cross-facies flow in the Wolfcamp B model. The dashed lines represent the matched production behavior in the Wolfcamp A (green) and Wolfcamp B (orange) using a single upscaled permeability (kups) in a homogeneous model. The recovery factor (RF) is the cumulative produced pore volume over the maximum producible pore volume for the given model parameters. The RF is 100% when the pore pressure in the domain equilibrates with the pressure in the fracture. The horizontal axis is represented as
  to illustrate that recovery rate declines as
  early on, and then it declines exponentially when the pressure drops below the initial pressure at the reservoir boundaries (see Patzek et al., 2013).
where Q is the cumulative produced pore volume (i.e., cumulative production) (m3) and VΔp is the producible pore volume (m3) given by

where cf is the fluid compressibility (Pa−1), Δp = pi – pf (Pa), and Vp, reservoir is the total pore volume (m3) of the reservoir. The RF is 100% when the fluid pressure (p) in the entire domain equals the pf. The horizontal axis is the square root of time; production is proportional to the inverse of the square root of time (1/√t) when the production profile is a straight line. We see that production starts declining proportionally to 1/√t, whereas it declines more rapidly in late time (black curve, Figure 21).
We compare the RF for the modeled system (black curve, Figure 21) to the case where there is no cross-facies flow (i.e., lower bound; red curve, Figure 21). A total of 50% of the producible pore volume is recovered (RF = 50%) almost four times faster with cross-facies flow compared with the model with no cross-facies flow. The RF for the modeled system is lower than the case in which the permeability of the upper layer is very large (e.g., kh2 = 109 nd). This case represents the maximum rate at which the low permeability rock could be produced (i.e., upper bound; gray curve, Figure 21). An RF of 50% is reached after ∼1 yr of production time, compared to ∼2 yr required when the high-permeability layer is less permeable.
We also model the permeability that would be required to produce the production rate for the modeled system (black curve, Figure 21) if only one lithofacies were present. We call this the upscaled permeability (kups). We estimated the kups by performing flow simulations in a homogeneous model with equal permeability in both layers and the equivalent average pore volume as the two-layer model. The production with cross-facies flow requires a kups of 74 nd (green dashed curve, Figure 21). This kups is almost four times higher than the permeability in a model consisting of only low-permeability strata (i.e., 20 nd).
We repeated these simulations for the Wolfcamp B dimensions (Table 3) to compare its production performance with the Wolfcamp A. The Wolfcamp B model (blue curve, Figure 21) required a kups of 40 nd (orange dashed curve, Figure 21), which is lower than that in the Wolfcamp A (kups = 74 nd), but it is still twice the mudstone permeability (i.e., 20 nd). Table 4 summarizes the simulation results in the Wolfcamp A and Wolfcamp B models.

The increase in the thickness of the low-permeability layer (h1), while setting the thickness of the high-permeability layer (h2) constant, results in slower production rates (Figure 22). The kups of the system is 74 nd at h1, and then it progressively approaches 20 nd when the h1 thickness is increased. Hence, the upscaled permeabilities, and therefore the production rates, approach the behavior of a model consisting of only mudstones when the NG thickness of the high-permeability layer to the low-permeability strata decreases.
 Figure 22. Simulation results for layered model with increasing thickness of the low-permeability layer (h1). The dashed green line represents the matched production behavior in a Wolfcamp A homogeneous model, with a single upscaled permeability (kups) of 74 nd. The red curve is the production in a homogeneous model composed on only low-permeability strata, with a kups of 20 nd. As h1 increases, the production rates decrease and the kups approaches 20 nd. The recovery factor (RF) is the cumulative produced pore volume over the maximum producible pore volume for the given model parameters. The RF is 100% when the pore pressure in the domain equilibrates with the pressure in the fracture. h2 = thickness of the high-permeability layer (layer 2).
We have assumed that the hydraulic fractures (i.e., producing face at the left boundary) are infinitely conductive. Thus, all of the fluids produced at the fracture face are transported within the hydraulic fracture to the wellbore without any flow restriction. However, if hydraulic fractures are not infinitely conductive, the fracture permeability may control the production rates if it is smaller than the upscaled reservoir permeability.
Implications of Cross-Facies Flow for Spacing between Hydraulic Fractures
The faster reservoir drainage occurring when high-permeability layers are intersected by hydraulic fractures has important implications for well completion designs. Figure 23 represents the RFs and cumulative production (Q) for different reservoir lengths (L) at the end of 5 yr in the Wolfcamp A and Wolfcamp B models. When there is cross-facies flow (Figure 23A, C), RFs are very high at short L. As L increases, RFs decline sharply and then plateau at L beyond ∼100 ft. In contrast, the cumulative production increases rapidly at increasing L, but they plateau at L beyond ∼75 ft. This indicates that although RFs are very high at shorter L, the cumulative production is small. Also, at L beyond ∼75 ft, there is no significant increase in cumulative production and RFs. Considering that L in our model is half the distance between two consecutive hydraulic fractures, the optimal spacing between hydraulic fractures in this example to maximize RFs and cumulative production at the end of 5 yr would be ∼150 ft (i.e., 2L).
 Figure 23. Recovery factor (RF) (black curve) and cumulative production (Q) (gray curve) at reservoir lengths (L) between 5 and 300 ft in the Wolfcamp A and Wolfcamp B models at the end of 5 yr of production. (A) Wolfcamp A model with cross-facies flow between low- and high-permeability layers. (B) Wolfcamp A model consisting of low-permeability strata, with kups = 20 nd. (C) Wolfcamp B model with cross-facies flow between low- and high-permeability layers. (D) Wolfcamp B model consisting of low-permeability strata, with kups = 20 nd.
If the Wolfcamp A and Wolfcamp B reservoirs were entirely composed of low-permeability mudstones (e.g., kups = 20 nd), then the RFs would decline more sharply and the cumulative production would plateau at much shorter reservoir lengths (e.g., L ∼25 ft) (Figure 23B, D) compared to reservoirs with cross-facies flow between low- and high-permeability layers (Figure 23A, C). Therefore, completions in reservoirs consisting of only low-permeability strata require shorter spacing between hydraulic fractures to maximize RFs and cumulative production.
DISCUSSION
This work further resolves a growing conceptual view of Wolfcamp reservoirs in distal portions of the Delaware Basin. These reservoirs are dominated volumetrically by organic-rich ![]() siliceous
siliceous![]() mudstones and organic-lean clay-rich argillaceous mudstones. Our analysis suggests that a significant oil saturation is stored in the
mudstones and organic-lean clay-rich argillaceous mudstones. Our analysis suggests that a significant oil saturation is stored in the ![]() siliceous
siliceous![]() mudstones, whereas the argillaceous mudstones are mostly saturated with water. These findings coincide with observations made in other recent work (Thompson et al., 2018; Zhang et al., 2021). The organic-rich
mudstones, whereas the argillaceous mudstones are mostly saturated with water. These findings coincide with observations made in other recent work (Thompson et al., 2018; Zhang et al., 2021). The organic-rich ![]() siliceous
siliceous![]() mudstone and the argillaceous mudstone are volumetrically the dominant lithofacies in Wolfcamp reservoirs and have the highest porosity. Thus, they represent 94% of the total pore volume in the studied section (Figure 6). In contrast, the carbonate gravity flow deposits have much lower porosity and generally lower TOC. We interpret, and it is supported by others (Thompson et al., 2018; Zhang et al., 2021), that the hydrocarbon saturations are high in these deposits.
mudstone and the argillaceous mudstone are volumetrically the dominant lithofacies in Wolfcamp reservoirs and have the highest porosity. Thus, they represent 94% of the total pore volume in the studied section (Figure 6). In contrast, the carbonate gravity flow deposits have much lower porosity and generally lower TOC. We interpret, and it is supported by others (Thompson et al., 2018; Zhang et al., 2021), that the hydrocarbon saturations are high in these deposits.
Our permeability measurements show that when the carbonate gravity flow deposits are dolomitized, they have remarkable permeability that is as much as 2000 times greater than the organic-rich ![]() siliceous
siliceous![]() mudstone and argillaceous mudstone (Figure 9). Such high permeability is due to the dissolution, either partial or total, of carbonate grains. The interparticle pores between quartz microcrystals also contribute to permeability in these lithofacies. The dolomitized carbonate gravity flow deposits have remarkably high permeability despite their low porosity. The MICP data clearly suggest that pores in these deposits form well-connected pore systems.
mudstone and argillaceous mudstone (Figure 9). Such high permeability is due to the dissolution, either partial or total, of carbonate grains. The interparticle pores between quartz microcrystals also contribute to permeability in these lithofacies. The dolomitized carbonate gravity flow deposits have remarkably high permeability despite their low porosity. The MICP data clearly suggest that pores in these deposits form well-connected pore systems.
A simple reservoir model shows that these permeable dolomitized carbonate flow deposits act as drainage pathways during production when intersected by hydraulic fractures (Figure 20). Initially, production lowers the fluid pressure within the hydraulic fractures, and fluids within the dolomitized carbonate deposits will be rapidly produced; thereafter, these permeable layers act as conduits to drain the less-permeable strata. This results in reservoir upscaled permeabilities that are higher (e.g., approximately four times higher) than a reservoir composed of only organic-rich ![]() siliceous
siliceous![]() mudstones. The permeability of 560 nd that we used for the high-permeability layer in this model may be underestimated. The maximum permeability of samples from the dolomitic calcareous mudstone and dolomitic calcareous sandstone lithofacies is up to 2000 nd. Hence, we can expect higher upscaled permeabilities, and therefore faster production rates, closer to the upper bound performance when layers with such high permeabilities are produced.
mudstones. The permeability of 560 nd that we used for the high-permeability layer in this model may be underestimated. The maximum permeability of samples from the dolomitic calcareous mudstone and dolomitic calcareous sandstone lithofacies is up to 2000 nd. Hence, we can expect higher upscaled permeabilities, and therefore faster production rates, closer to the upper bound performance when layers with such high permeabilities are produced.
The observations described above can inform completion strategies. For example, production rates will be greater when hydraulic fractures intersect permeable dolomitized carbonate flow deposits interbedded with relatively thin organic-rich ![]() siliceous
siliceous![]() mudstone layers. In addition, intervals with high NG of the permeable deposits should be reservoir stimulation targets because they will yield better production rates. Thus, this may be used as a tool to target the most optimal landing zones. In this study, it is clear that the Wolfcamp A unit will be potentially more productive than the Wolfcamp B because the NG of the permeable deposits is higher.
mudstone layers. In addition, intervals with high NG of the permeable deposits should be reservoir stimulation targets because they will yield better production rates. Thus, this may be used as a tool to target the most optimal landing zones. In this study, it is clear that the Wolfcamp A unit will be potentially more productive than the Wolfcamp B because the NG of the permeable deposits is higher.
In addition, the presence of permeable deposits will impact the optimal spacing between hydraulic fractures (Figure 23). To achieve the same RF, the spacing between hydraulic fractures can be larger in reservoirs containing high-permeability layers (e.g., 2L ∼150 ft) compared to well completions in intervals composed only of low-permeability strata (e.g., 2L ∼50 ft). Longer spacing between hydraulic fractures may require fewer hydraulic fracture treatments, which would lower completion costs. An important aspect to consider in these analyses is that if hydraulic fractures are not sufficiently conductive, then production rates may be limited by the fracture permeability if it is smaller than the upscaled reservoir permeability. In this scenario, the impact of the high-permeability layers on production rates is limited, and more hydraulic fractures per lateral length in the horizontal well may be needed.
Finally, a topic not explored in depth here is the implication of this drainage behavior for the production interference of parent-child wells. This is a persistent problem in the development of some unconventional fields, where the production performance in initial wells (i.e., parent well) is higher than that in ensuing wells drilled and completed nearby (i.e., child wells) (Miller et al., 2016; Xu et al., 2019). If the permeable layers extend beyond individual hydraulic fractures in a completed interval, then we would expect drainage to extend outward from a particular well to other prospective completion zones for child wells. In this case, the parent well would drain relatively rapidly from the mudstone adjacent to the permeable bed over a large distance. Subsequent wells drilled and completed within the same interval would encounter mudstones that were partially depleted, resulting in slower production rates.
At the broadest level, this work reminds us of the fundamental importance of understanding how lithology controls flow at the decimeter scale, and perhaps smaller. It suggests that, although volumetrically small, permeable carrier beds have a major influence on the production behavior; they increase the upscaled permeability of the system due to cross-facies flow. This view illuminates why reservoir simulation models often require much higher permeabilities than those measured in the laboratory for the dominant lithofacies to successfully match production rates (e.g., Mohan et al., 2013; Patzek et al., 2013; Defeu et al., 2018; Parsegov et al., 2018). It is often assumed that reservoir upscaled permeability is high due to the development of complex hydraulic fracture networks (e.g., dendritic) that intersect and reopen natural fractures during stimulation. However, these complex fracture networks are not observed in slant cores retrieved from hydraulically fractured reservoirs (Gale et al., 2018, 2021; Raterman et al., 2018; Male et al., 2021), and vertical cores recovered from producing reservoir intervals indicate that natural fracture intensity does not correlate with production (Salem et al., 2022). In contrast, we infer that cross-facies flow drives the production above what may be expected given the measured permeabilities. Although this study is focused on the Wolfcamp, we infer that this drainage behavior will be present in other low-permeability reservoirs with significant permeability heterogeneity.
CONCLUSIONS
We determined the effect of stratigraphic heterogeneity on flow behavior during production in the upper Wolfcamp interval (Wolfcamp B, Wolfcamp A) at a specific location in Delaware Basin through an integrated geological and petrophysical study. We found that ∼95% of the pore volume is present in the organic-rich ![]() siliceous
siliceous![]() mudstone and argillaceous mudstone deposits. This suggests that most fluids produced in the upper Wolfcamp originate in mudstone lithofacies. Our permeability measurements show that most lithofacies have a horizontal effective matrix permeability to dodecane (oil phase) below 60 nd, whereas the dolomitic calcareous mudstone and dolomitic calcareous sandstone lithofacies exhibit horizontal effective matrix permeabilities up to 2000 nd.
mudstone and argillaceous mudstone deposits. This suggests that most fluids produced in the upper Wolfcamp originate in mudstone lithofacies. Our permeability measurements show that most lithofacies have a horizontal effective matrix permeability to dodecane (oil phase) below 60 nd, whereas the dolomitic calcareous mudstone and dolomitic calcareous sandstone lithofacies exhibit horizontal effective matrix permeabilities up to 2000 nd.
Interparticle pores between mineral grains, and possibly nonorganic intraparticle pores formed by dissolution, control matrix permeability in upper Wolfcamp lithofacies. The pore throat size distribution further indicates that larger pore throats correlate with higher matrix permeabilities. We show that the dolomitic calcareous mudstone and dolomitic calcareous sandstone have the highest matrix permeabilities of all of the lithofacies because their pore system is dominated by nonorganic inter- and intraparticle pores with large throats. Geological information indicates that these permeable lithofacies correspond to dolomitized carbonate sediment gravity flow deposits that may be laterally continuous (e.g., >10 mi), and therefore, they may represent preferential flow pathways during production at the completion scale.
Flow simulations suggest that cross-facies flow from the mudstones to the permeable deposits dominates drainage during production due to the contrast in permeability between the lithofacies (permeabilities ranging from 1 to 2000 nd). The permeable layers focus flow toward hydraulic fractures and dramatically increase the drainage expected from the low-permeability lithofacies. We show a fourfold increase in the reservoir upscaled permeability when compared to a system composed of only low-permeability mudstones. Therefore, reservoir models in the Wolfcamp should account for the presence of permeable layers to describe well performance and design field development plans (e.g., optimal landing zones, spacing between hydraulic fractures, and well spacing).
This integrative study provides a generalized conceptual model that emphasizes the role of stratigraphy in the economic production of hydrocarbons from unconventional formations worldwide. A systematic exploration and production approach that recognizes the role of high-permeability layers in these formations, even if these layers are volumetrically small, will result in more efficient completion strategies and, therefore, better production rates and recovery factors.
REFERENCES CITED
Abràmoff, M. D., P. J. Magalhães, and S. J. Ram, 2004, Image processing with ImageJ: Biophotonics International, v. 11, no. 7, p. 36–42.
Bernard, S., B. Horsfield, H.-M. Schulz, R. Wirth, A. Schreiber, and N. Sherwood, 2012a, Geochemical evolution of organic-rich shales with increasing maturity: A STXM and TEM study of the Posidonia Shale (Lower Toarcian, northern Germany): Marine and Petroleum Geology, v. 31, no. 1, p. 70–89, doi:10.1016/j.marpetgeo.2011.05.010.
Bernard, S., R. Wirth, A. Schreiber, H.-M. Schulz, and B. Horsfield, 2012b, Formation of nanoporous pyrobitumen residues during maturation of the Barnett Shale (Fort Worth Basin): International Journal of Coal Geology, v. 103, p. 3–11, doi:10.1016/j.coal.2012.04.010.
Best, M. E., and T. J. Katsube, 1995, Shale permeability and its significance in hydrocarbon exploration: The Leading Edge, v. 14, no. 3, p. 165–170, doi:10.1190/1.1437104.
Bhandari, A. R., P. B. Flemings, R. Hofmann, and P. J. Polito, 2018, Stress-dependent in situ gas permeability in the Eagle Ford Shale: Transport in Porous Media, v. 123, no. 1, p. 1–20, doi:10.1007/s11242-018-1021-6.
Bhandari, A. R., P. B. Flemings, S. Ramiro-Ramirez, R. Hofmann, and P. J. Polito, 2019, Gas and liquid permeability measurements in Wolfcamp samples: Fuel, v. 236, p. 1026–1036, doi:10.1016/j.fuel.2018.09.038.
Bohacs, K. M., Q. R. Passey, M. D. Rudnicki, W. L. Esch, and O. R. Lazar, 2013, The spectrum of fine-grained reservoirs from ‘shale gas’ to ‘shale oil’/tight liquids: Essential attributes, key controls, practical characterization: International Petroleum Technology Conference, Beijing, China, March 26–28, 2013, IPTC 16676, 16 p.
Brace, W. F., J. B. Walsh, and W. T. Frangos, 1968, Permeability of granite under high pressure: Journal of Geophysical Research, v. 73, no. 6, p. 2225–2236, doi:10.1029/JB073i006p02225.
Camp, W. K., and B. Wawak, 2013, Enhancing SEM grayscale images through pseudocolor conversion: Examples from Eagle Ford, Haynesville, and Marcellus shales, in W. K. Camp, E. Diaz, and B. Wawak, eds., Electron microscopy of shale reservoirs: AAPG Memoir 102, p. 15–26, doi:10.1306/13391701M1021681.
Chhatre, S. S., E. M. Braun, S. Sinha, M. D. Determan, Q. R. Passey, T. E. Zirkle, A. C. Wood, , 2015, Steady-state stress-dependent permeability measurements of tight oil-bearing rocks: Petrophysics, v. 56, no. 2, p. 116–124.
COMSOL, 2016, Home page, accessed March 14, 2022, www.comsol.com.
Curtis, M. E., R. J. Ambrose, C. H. Sondergeld, and C. S. Rai, 2010, Structural characterization of gas shales on the micro- and nano-scales: Canadian Unconventional Resources & International Petroleum Conference, Calgary, Alberta, Canada, October 19–21, 2010, SPE-137693-MS, 15 p., doi:10.2118/137693-MS.
Curtis, M. E., B. J. Cardott, C. H. Sondergeld, and C. S. Rai, 2012, Development of organic porosity in the Woodford Shale with increasing thermal maturity: International Journal of Coal Geology, v. 103, p. 26–31, doi:10.1016/j.coal.2012.08.004.
Defeu, C., G. G. Ferrer, E. Ejofodomi, D. Shan, and F. Alimahomed, 2018, Time dependent depletion of parent well and impact on well spacing in the Wolfcamp Delaware Basin: Society of Petroleum Engineers Liquids-Rich Basins Conference-North America, Midland, Texas, September 5–6, 2018, SPE-191799-MS, 13 p., doi:10.2118/191799-MS.
Dobber, A. W., and R. H. Goldstein, 2020, Diagenetic controls on reservoir character of the Lower Permian Wolfcamp and Bone Spring formations in the Delaware Basin, West Texas: Society of Petroleum Engineers/AAPG/Society of Exploration Geophysicists Unconventional Resources Technology Conference, Austin, Texas, July 20–22, 2020, URTeC 3181, 23 p., doi:10.15530/urtec-2020-3181.
Dong, J.-J., J.-Y. Hsu, W.-J. Wu, T. Shimamoto, J.-H. Hung, E.-C. Yeh, Y.-H. Wu, and H. Sone, 2010, Stress-dependence of the permeability and porosity of sandstone and shale from TCDP Hole-A: International Journal of Rock Mechanics and Mining Sciences, v. 47, no. 7, p. 1141–1157, doi:10.1016/j.ijrmms.2010.06.019.
Dutton, S. P., E. M. Kim, R. F. Broadhead, W. D. Raatz, C. L. Breton, S. C. Ruppel, and C. Kerans, 2005, Play analysis and leading-edge oil-reservoir development methods in the Permian basin: increased recovery through advanced technologies: AAPG Bulletin, v. 89, no. 5, p. 553–576, doi:10.1306/12070404093.
Energy Information Administration, 2022, Tight oil production estimates by play, accessed August 21, 2022, https://www.eia.gov/energyexplained/oil-and-petroleum-products/data/US-tight-oil-production.xlsx.
Euzen, T., N. Watson, M. Fowler, A. Mort, and T. F. Moslow, 2021, Petroleum distribution in the Montney hybrid play: Source, carrier bed, and structural controls: AAPG Bulletin, v. 105, no. 9, p. 1867–1892, doi:10.1306/12222020088.
Fraser, J. A., and P. K. Pedersen, 2021, Reservoir characterization of fairways in a tight light oil play of the Upper Cretaceous Cardium Formation, west Pembina, Alberta, Canada: AAPG Bulletin, v. 105, no. 9, p. 1797–1820, doi:10.1306/06032120131.
Fredd, C. N., and H. S. Fogler, 1998, Influence of transport and reaction on wormhole formation in porous media: AIChE Journal, v. 44, no. 9, p. 1933–1949, doi:10.1002/aic.690440902.
Fu, Q., R. W. Baumgardner Jr., and H. S. Hamlin, 2020, Early Permian (Wolfcampian) succession in the Permian Basin: Icehouse platform, slope carbonates, and basinal mudrocks, in S. C. Ruppel, ed., Anatomy of a Paleozoic basin: The Permian Basin, USA: AAPG Memoir 118, p. 185–226.
Gale, J. F. W., S. J. Elliott, and S. E. Laubach, 2018, Hydraulic fractures in core from stimulated reservoirs: Core fracture description of HFTS Slant Core, Midland Basin, West Texas: Society of Petroleum Engineers/AAPG/Society of Exploration Geophysicists Unconventional Resources Technology Conference, Houston, Texas, July 23–25, 2018, URTeC 2902624, 18 p., doi:10.15530/urtec-2018-2902624.
Gale, J. F. W., S. J. Elliott, B. G. Rysak, C. L. Ginn, N. Zhang, R. D. Myers, and S. E. Laubach, 2021, Fracture description of the HFTS-2 slant core, Delaware Basin, West Texas: Society of Petroleum Engineers/AAPG/Society of Exploration Geophysicists Unconventional Resources Technology Conference, Houston, Texas, July 26–28, 2021, URTeC 5175, 12 p., doi:10.15530/urtec-2021-5175.
Gale, J. F. W., R. M. Reed, and J. Holder, 2007, Natural fractures in the Barnett Shale and their importance for hydraulic fracture treatments: AAPG Bulletin, v. 91, no. 4, p. 603–622, doi:10.1306/11010606061.
Huang, J., T. Cavanaugh, and B. Nur, 2003, An introduction to SEM operational principles and geologic applications for shale hydrocarbon reservoirs, in W. K. Camp, E. Diaz, and B. Wawak eds., Electron microscopy of shale hydrocarbon reservoirs: AAPG Memoir 102, p. 1–6, doi:10.1306/13391699M1023580.
Hunt, D., and W. M. Fitchen, 1999, Compaction and the dynamics of carbonate-platform development: Insights from the Permian Delaware and Midland basins, southeast New Mexico and west Texas, U.S.A, in P. M. Harris, A. H. Saller, and J. A. Simo, eds., Advances in carbonate sequence stratigraphy: Application to reservoirs, outcrops and models: Tulsa, Oklahoma, SEPM Special Publication 63, p. 75–106, doi:10.2110/pec.99.11.0075.
Jarvie, D. M., R. J. Hill, T. E. Ruble, and R. M. Pollastro, 2007, Unconventional shale-gas systems: The Mississippian Barnett Shale of north-central Texas as one model for thermogenic shale-gas assessment: AAPG Bulletin, v. 91, no. 4, p. 475–499, doi:10.1306/12190606068.
Katz, M. L., and M. R. Tek, 1962, A theoretical study of pressure distribution and fluid flux in bounded stratified porous systems with crossflow: SPE Journal, v. 2, no. 01, p. 68–82, doi:10.2118/146-PA.
King, H., M. Sansone, P. Kortunov, Y. Xu, N. Callen, S. Chhatre, H. Sahoo, and A. Buono, 2018, Microstructural investigation of stress-dependent permeability in tight-oil rocks: Petrophysics, v. 59, no. 1, p. 35–43, doi:10.30632/PJV59N1-2018a3.
Kosanke, T., and A. Warren, 2016, Geological controls on matrix permeability of the Eagle Ford Shale (Cretaceous), South Texas, U.S.A, in J. A. Breyer, ed., The Eagle Ford Shale: A renaissance in U.S. oil production: AAPG Memoir 110, p. 285–300, doi:10.1306/13541966M1103665.
Kuhl, E. J., 2003, Optimization of recovery from two-layer reservoirs with crossflow, M.S. thesis, The Pennsylvania State University, State College, Pennsylvania, 95 p.
Kurtoglu, B., 2013, Integrated reservoir characterization and modeling in support of enhanced oil recovery for Bakken, Ph.D. thesis, Colorado School of Mines, Golden, Colorado, 221 p.
Loucks, R. G., R. M. Reed, S. C. Ruppel, and D. M. Jarvie, 2009, Morphology, genesis, and distribution of nanometer-scale pores in ![]() siliceous
siliceous![]() mudstones of the Mississippian Barnett Shale: Journal of Sedimentary Research, v. 79, no. 12, p. 848–861, doi:10.2110/jsr.2009.092.
mudstones of the Mississippian Barnett Shale: Journal of Sedimentary Research, v. 79, no. 12, p. 848–861, doi:10.2110/jsr.2009.092.
Male, F., B. Rysak, and R. Dommisse, 2021, Statistical analysis of fractures from the hydraulic fracture test site 1: Society of Petroleum Engineers/AAPG/Society of Exploration Geophysicists Unconventional Resources Technology Conference, Houston, Texas, July 26–28, 2021, 15 p., doi:10.15530/urtec-2021-5450.
Mastalerz, M., A. Drobniak, and A. B. Stankiewicz, 2018, Origin, properties, and implications of solid bitumen in source-rock reservoirs: A review: International Journal of Coal Geology, v. 195, p. 14–36, doi:10.1016/j.coal.2018.05.013.
Mathur, A., C. H. Sondergeld, and C. S. Rai, 2016, Comparison of steady-state and transient methods for measuring shale permeability: Society of Petroleum Engineers Low Perm Symposium, Denver, Colorado, May 5–6, 2016, SPE-180259-MS, 22 p., doi:10.2118/180259-MS.
Mavor, M., 2014, Reservoir fluid properties required for low-permeability oil reservoir analysis: AAPG Search and Discovery article 80363, accessed January 1, 2022, https://www.searchanddiscovery.com/pdfz/documents/2014/80363mavor/ndx_mavor.pdf.html.
Mazzullo, J. M., 2000, Organogenic dolomitization in peritidal to deep-sea sediments: Journal of Sedimentary Research, v. 70, no. 1, p. 10–23, doi:10.1306/2DC408F9-0E47-11D7-8643000102C1865D.
McKernan, R., J. Mecklenburgh, E. Rutter, and K. Taylor, 2017, Microstructural controls on the pressure-dependent permeability of Whitby mudstone, in E. H. Rutter, J. Mecklenburgh, and K. G. Taylor, eds., Geomechanical and petrophysical properties of mudrocks: Geological Society, London, Special Publications 2017, v. 454, p. 39–66, doi:10.1144/SP454.15.
Miller, G., G. Lindsay, J. Baihly, and T. Xu, 2016, Parent well refracturing: Economic safety nets in an uneconomic market: Society of Petroleum Engineers Low Perm Symposium, Denver, Colorado, May 5–6, 2016, SPE-180200-MS, 15 p., doi:10.2118/180200-MS.
Milliken, K. L., L. T. Ko, M. Pommer, and K. M. Marsaglia, 2014, SEM petrography of Eastern Mediterranean sapropels: Analogue data for assessing organic matter in oil and gas shales: Journal of Sedimentary Research, v. 84, no. 11, p. 961–974, doi:10.2110/jsr.2014.75.
Mohan, K., K. D. Scott, G. D. Monson, and P. A. Leonard, 2013, A systematic approach to understanding well performance in unconventional reservoirs: A Wolfcamp case study: Society of Petroleum Engineers/AAPG/Society of Exploration Geophysicists Unconventional Resources Technology Conference, Denver, Colorado, August 12–14, 2013, URTeC 1579514, 10 p., doi:10.1190/urtec2013-051.
Park, H., 1989, Well test analysis of a multilayered reservoir with formation crossflow, Ph.D. thesis, Stanford University, Stanford, California, 152 p., doi:10.2118/19800-MS.
Parsegov, S. G., K. Nandlal, D. S. Schechter, and R. Weijermars, 2018, Physics-driven optimization of drained rock volume for multistage fracturing: Field example from the Wolfcamp Formation, Midland Basin: Society of Petroleum Engineers/AAPG/Society of Exploration Geophysicists Unconventional Resources Technology Conference, Houston, Texas, July 23–25, 2018, URTeC 2879159, 31 p., doi:10.15530/urtec-2018-2879159.
Passey, Q. R., K. M. Bohacs, W. L. Esch, R. Klimentidis, and S. Sinha, 2010, From oil-prone source rock to gas-producing shale reservoir – Geologic and petrophysical characterization of unconventional shale-gas reservoirs: International Oil and Gas Conference and Exhibition, Beijing, China, June 8–10, 2010, SPE-131350, 29 p., doi:10.2118/131350-MS.
Patzek, T. W., F. Male, and M. Marder, 2013, Gas production in the Barnett Shale obeys a simple scaling theory: Proceedings of the National Academy of Sciences of the United States of America, v. 110, no. 49, p. 19731–19736, doi:10.1073/pnas.1313380110.
Pendergrass, J. D., and V. J. Berry Jr., 1962, Pressure transient performance of a multilayered reservoir with crossflow: SPE Journal, v. 2, no. 04, p. 347–354, doi:10.2118/285-PA.
Phillips, O. M., 1991, Flow and reactions in permeable rocks: Cambridge, United Kingdom, Cambridge University Press, 296 p.
Rafatian, N., and J. Capsan, 2015, Petrophysical characterization of the pore space in Permian Wolfcamp rocks: Petrophysics, v. 56, no. 1, p. 45–57.
Ramiro-Ramirez, S., 2022, Integrated stratigraphic and petrophysical analysis of the Wolfcamp at Delaware Basin, West Texas, USA, Ph.D. thesis, The University of Texas at Austin, Austin, Texas, 389 p., doi:10.26153/tsw/42093.
Ramiro-Ramirez, S., P. B. Flemings, A. R. Bhandari, and O. S. Jimba, 2021, Steady-state liquid permeability measurements in samples from the Bakken Formation, Williston Basin, USA: Society of Petroleum Engineers Annual Technical Conference and Exhibition, Dubai, United Arab Emirates, September 21–23, 2021, SPE-206382-MS, 15 p., doi:10.2118/206382-MS.
Raterman, K. T., H. E. Farrell, O. S. Mora, A. L. Janssen, G. A. Gomez, S. Busetti, J. McEwen, , 2018, Sampling a stimulated rock volume: An Eagle Ford example: SPE Reservoir Evaluation & Engineering, v. 21, no. 4, p. 927–941, doi:10.2118/191375-PA.
Romero-Sarmiento, M.-F., S. Ramiro-Ramirez, G. Berthe, M. Fleury, and R. Littke, 2017, Geochemical and petrophysical source rock characterization of the Vaca Muerta Formation, Argentina: Implications for unconventional petroleum resource estimations: International Journal of Coal Geology, v. 184, p. 27–41, doi:10.1016/j.coal.2017.11.004.
Russell, D. G., and M. Prats, 1962, The practical aspects of interlayer crossflow: Journal of Petroleum Technology, v. 14, no. 6, p. 589–594, doi:10.2118/369-PA.
Rydzy, M. B., J. Patino, N. Elmetni, and M. Appel, 2016, Stressed permeability in shales: Effects of matrix compressibility and fractures - A step towards measuring matrix permeability in fractured shale samples: International Symposium of the Society of Core Analysts, Snowmass, Colorado, August 21–26, 2016, SCA2016-027, 12 p.
Sagasti, G., A. Ortiz, D. Hryb, M. Foster, and V. Lazzari, 2014, Understanding geological heterogeneity to customize field development: An example from the Vaca Muerta unconventional play, Argentina: Society of Petroleum Engineers/AAPG/Society of Exploration Geophysicists Unconventional Resources Technology Conference, Denver, Colorado, August 25–27, 2014, URTeC 1923357, 20 p., doi:10.15530/urtec-2014-1923357.
Salem, A. C., S. J. Naruk, and J. G. Solum, 2022, Impact of natural fractures on production from an unconventional shale: The Delaware Basin Wolfcamp shale: AAPG Bulletin, v. 106, no. 1, p. 1–20, doi:10.1306/07272118227.
Schieber, J., 2010, Common themes in the formation and preservation of intrinsic porosity in shales and mudstones – Illustrated with examples across the Phanerozoic: Society of Petroleum Engineers Unconventional Gas Conference, Pittsburgh, Pennsylvania, February 23–25, 2010, SPE-132370, 10 p., doi:10.2118/132370-MS.
Sinclair, T. D., 2007, The generation and continued existence of overpressure in the Delaware Basin, Texas, Ph.D. thesis, University of Durham, Durham, United Kingdom, 302 p.
Teklu, T. W., X. Li, Z. Zhou, and H. Abass, 2018, Experimental investigation on permeability and porosity hysteresis of tight formations: SPE Journal, v. 23, no. 03, p. 672–690, doi:10.2118/180226-PA.
Thomeer, J. H. M., 1960, Introduction of a pore geometrical factor defined by the capillary pressure curve: Journal of Petroleum Technology, v. 12, no. 03, p. 73–77, doi:10.2118/1324-G.
Thompson, M., P. Desjardins, J. Pickering, and B. Driskill, 2018, An integrated view of the petrology, sedimentology, and sequence stratigraphy of the Wolfcamp Formation, Delaware Basin, Texas: Society of Petroleum Engineers/AAPG/Society of Exploration Geophysicists Unconventional Resources Technology Conference, Houston, Texas, July 23–25, 2018, URTeC 2901513, 8 p., doi:10.15530/urtec-2018-2901513.
Vermylen, J. P., 2011, Geomechanical studies of the Barnett Shale, Texas, USA, Ph.D. thesis, Stanford University, Stanford, California, 129 p.
Weijermars, R., K. Nandlal, M. F. Tugan, W. Dusterhoft, and N. Stegent, 2020, Wolfcamp hydraulic fracture test site drained rock volume and recovery factors visualized by scaled complex analysis method (CAM): Emulating multiple data sources (production rates, water cuts, pressure gauges, flow regime changes, and b-sigmoids): Society of Petroleum Engineers/AAPG/Society of Exploration Geophysicists Unconventional Resources Technology Conference, Austin, Texas, July 20–22, 2020, URTeC 2434, 42 p., doi:10.15530/urtec-2020-2434.
Wilson, R. D., J. Chitale, K. Huffman, P. Montgomery, and S. J. Prochnow, 2020, Evaluating the depositional environment, lithofacies variation, and diagenetic processes of the Wolfcamp B and lower Spraberry intervals in the Midland Basin: Implications for reservoir quality and distribution: AAPG Bulletin, v. 104, no. 6, p. 1287–1321, doi:10.1306/12031917358.
Xu, T., W. Zheng, J. Baihly, P. Dwivedi, D. Shan, R. Utech, and G. Miller, 2019, Permian Basin production performance comparison over time and the parent-child well study: Society of Petroleum Engineers Hydraulic Fracturing Technology Conference and Exhibition, The Woodlands, Texas, February 5–7, 2019, SPE-194310-MS, 38 p., doi:10.2118/194310-MS.
Yu, W., and K. Sepehrnoori, 2018, Shale gas and tight oil reservoir simulation: Cambridge, Massachusetts, Gulf Professional Publishing, 430 p., doi:10.1016/B978-0-12-813868-7.00001-8.
Zhan, L., P. S. Fair, R. J. Dombrowski, E. N. Quint, and R. Cao, 2018, Estimating ultralow permeability at multiple locations using simultaneous-impulse tests: A fit-for-purpose pressure-transient solution and its field application: SPE Journal, v. 23, no. 4, p. 1184–1200, doi:10.2118/187063-PA.
Zhang, T., Q. Fu, X. Sun, P. C. Hackley, L. T. Ko, and D. Shao, 2021, Meter-scale lithofacies cycle and controls on variations in oil saturation, Wolfcamp A, Delaware and Midland Basins: AAPG Bulletin, v. 105, no. 9, p. 1821–1846, doi:10.1306/01152120065.
Zoback, M. D., and A. H. Kohli, 2019, Unconventional reservoir geomechanics: Cambridge, United Kingdom, Cambridge University Press, 484 p., doi:10.1017/9781316091869.
AUTHORS
Sebastian Ramiro-Ramirez received his Ph.D. in geosciences from The University of Texas at Austin, an M.S. degree in geology from the Colorado School of Mines, and two B.S. degrees in geological engineering and geological sciences from the Universidad Complutense de Madrid. His research interests include petrophysics, sedimentology, reservoir characterization, and flow modeling in low-permeability formations.
Athma R. Bhandari is a research engineer at the Institute for Geophysics. He was a research associate at the Bureau of Economic Geology. He received his Ph.D. in civil-geotechnical engineering from the University of Southampton, United Kingdom. His current research areas include geomechanics and petrophysics and aims to advance our understanding of deformation and fluid flow behavior in soils and rocks.
Rob Reed is a research scientist associate at the Bureau of Economic Geology. He received his B.S. degree and his Ph.D. in geological sciences from The University of Texas at Austin and his M.S. degree in geology from the University of Massachusetts. His current research focuses on the various aspects of the microstructure of rocks.
Peter B. Flemings holds the Leonidas T. Barrow Centennial Chair in Mineral Resources at The University of Texas at Austin. He studies how fluid flow in basins drives geological processes, including hydrate formation, landslides, and overpressure development. He previously held positions at The Pennsylvania State University, Massachusetts Institute of Technology, and Columbia University.
ACKNOWLEDGMENTS
We thank Shell for funding this research under the Shell–University of Texas Unconventional Research agreement. Robert Dombrowski and Ronny Hofmann provided guidance and fruitful discussions, and Brian Driskill and Adenike Tokan-Lawal provided technical and logistical support. We thank Robert Baumgardner for his initial core descriptions and Evan Sivil for conducting the x-ray fluorescence measurements of the cores. Equinor provided additional funding for this research under The University of Texas-Equinor Fellows Program. The University of Texas GeoFluids Consortium, the Department of Earth and Planetary Sciences Ed. Owen - Geo. Coates Fund, and the Institute for Geophysics at The University of Texas at Austin supported the publication costs of this paper. The University of Texas GeoFluids Consortium is supported by BP, Chevron, ConocoPhillips, ExxonMobil, Eni, Hess Corporation, Oxy, Petrobras, Shell, and Woodside Energy. The University of Texas High-Resolution X-Ray Computed Tomography Facility, which is supported by the National Science Foundation through grant no. EAR-1762458, was used extensively in this research.
DATASHARE 178
Tables A1 and A2 are available in an electronic version on the AAPG website (